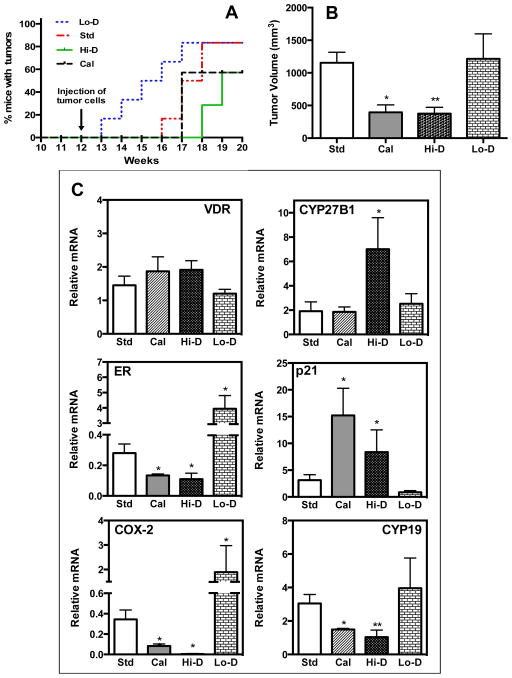
Fig. 2. Effect of calcitriol and dietary vitamin D3 levels on the appearance and growth of MMTV-Wnt1 tumors.
FVB/N mice were fed the standard diet (Std), a vitamin D-deficient diet (Lo-D) or a vitamin D-supplemented diet (Hi-D) for 12 weeks (Experimental weeks 0–12). A parallel experimental group consisted of mice on the standard diet receiving calcitriol injections (Cal) in the last seven weeks of the 12-week period (Experimental weeks 6–12). On Experimental week 12 MMTV-Wnt1 tumor cell suspensions were implanted in the left inguinal mammary fat pads of the mice. Diets and calcitriol treatments were continued for the next 7 weeks (Experimental weeks 12–19) and tumor appearance and growth were monitored.
A, Tumor appearance. Kaplan-Meier analysis of the occurrence of palpable tumors in mice in the various experimental groups: Std (red line), LO-D (blue line), Cal (green line) and Hi-D (magenta line). B, End-point tumor volumes. Tumor volumes in the various experimental groups at the end of the study are shown (The experiment was performed twice with half the number of mice each time. Total number of mice in each group was as follows: Std diet =10; Cal=6; Hi-D=6; and Lo-D=6.; * p<0.05 and ** p < 0.001 as compared to the Std group). C, Changes in mRNA expression of Vdr, CYP27B1, Erα, p21, Cox-2 and aromatase (Cyp19) in MMTV-Wnt1 tumors due to calcitriol and dietary vitamin D status. Relative mRNA expression of each gene is shown with the expression in tumors from mice on the standard diet (Std) set at 1. (n = 6–10 determinations; * p < 0.05 as compared to Std). Values represent mean ± SEM.

