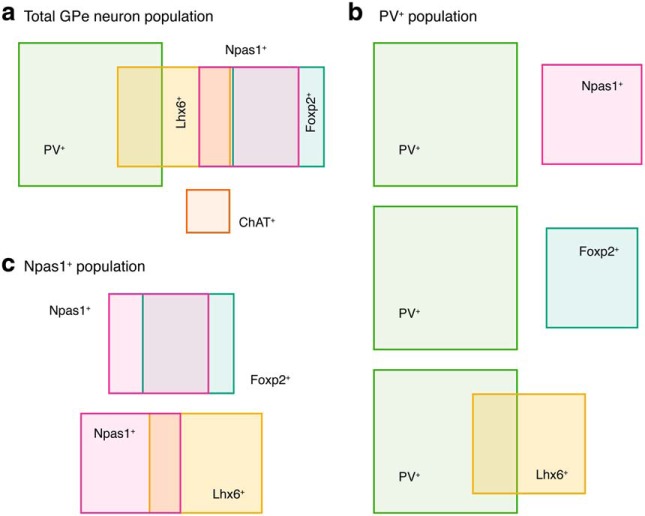
Figure 12.
Diagrams summarizing the classification scheme derived from the current study. a, A diagram showing the neuronal makeup of the mouse GPe. PV+ neurons (green), Npas1+ neurons (magenta), Lhx6+ neurons (mustard), Foxp2+ neurons (teal), and ChAT+ neurons (rust) are included in this classification scheme. The area of the rectangles represents the size of each neuron population. ChAT+ neurons are 5% of the total GPe neuron population and show no overlap with other known classes of GPe neurons. b, PV+ neurons and Npas1+ neurons are two principal, largely nonoverlapping neuron classes in the mouse GPe. They represent 55% and 27% of the total GPe neuron population. PV+ neurons and Foxp2+ neurons are also nonoverlapping. The latter constitutes 24% of the total GPe population. In contrast, 27% of PV+ neurons are Lhx6+. c, Npas1+ neurons and Foxp2+ neurons are two largely overlapping populations; 80% of Foxp2 neurons express Npas1. The remaining (28%) Foxp2−-Npas1+ population is Lhx6+.

