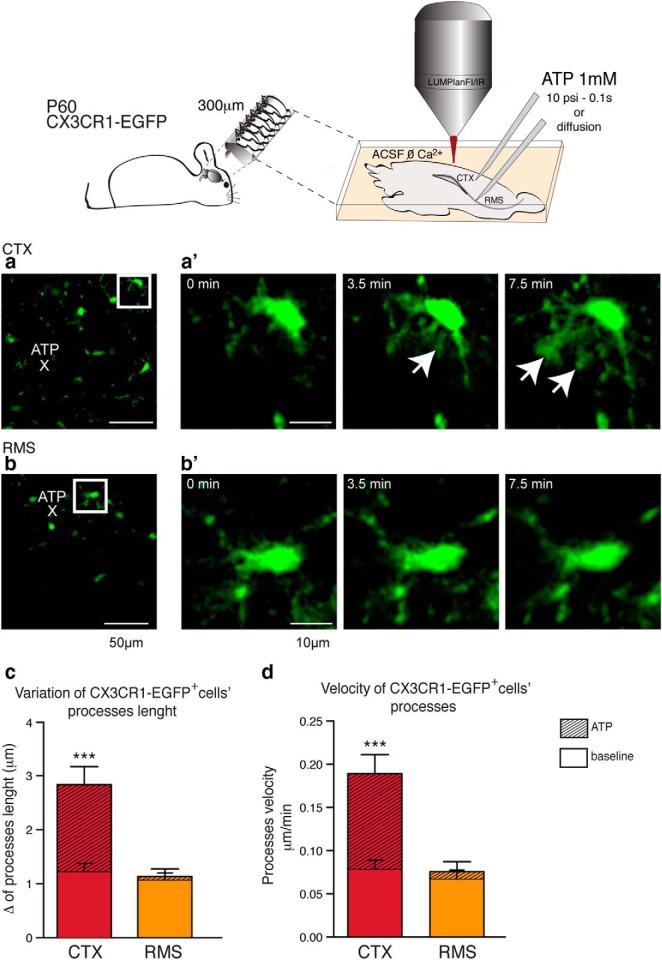
Figure 4.
Differential expression of P2RY12 determines the attenuated responsiveness to ATP by RMS microglia cells. Slices (300 μm) were obtained from vibratome sectioning of CX3CR1-EGFP mice (P60). During 2-photon analysis, slices were kept on ACSF ØCa2+ perfused with 5% CO2/95% O2 and, once ATP was applied, imaging scanning were performed every 15 s for a total interval of 15 min. Glass pipettes (10–20 μm diameter) were positioned directly to cortical parenchyma or into the RMS and ATP (1 mm) was allowed to diffuse or applied with a 10 psi pressure force for 0.1 s (schematic drawing). ATP release within the cortical parenchyma (a) triggers microglia (EGFP, green) processes extension (a′, arrows). In contrast, when applied into the RMS, exogenous ATP does not trigger a robust recruitment of microglial processes (b, b′). Two-photon imaging showed that cortical microglial processes avidly extended toward the sites of ATP injection, whereas ATP-stimulated process movement by RMS microglia was barely appreciable (c) (baseline CTX: 1.23 ± 0.15; ATP CTX: 2.83 ± 0.33; baseline RMS: 1.05 ± 0.13; ATP RMS: 1.13 ± 0.14 μm; mean ± SEM; p < 0.0005; Mann–Whitney test). We also compared the velocity of single processes in response to ATP in the CTX and RMS, and found a significant increase in cortical microglial process speed relative to that of the CX3CR1-EGFP+ processes of RMS microglia, which were essentially unresponsive to ATP (baseline CTX: 0.08 ± 0.01; ATP CTX: 0.19 ± 0.02; baseline RMS: 0.07 ± 0.01; ATP RMS: 0.08 ± 0.01 μm/min; mean ± SEM; p < 0.0005; Mann–Whitney test; d). Scale bars: a, b, 50 μm; a′, b′, 10 μm.

