Figure 7.
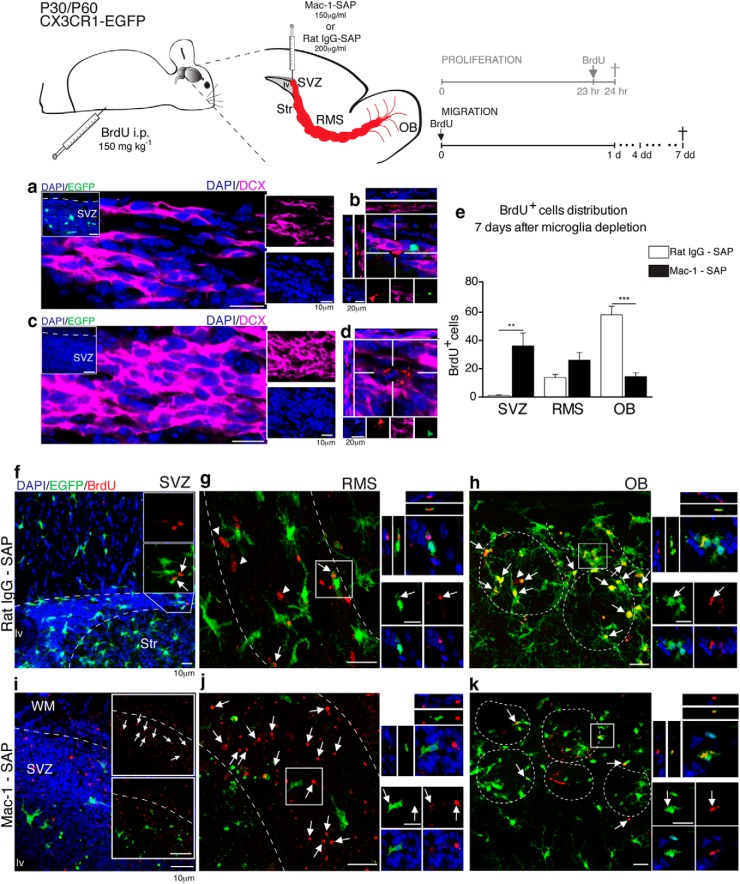
SVZ-microglia depletion disrupts neuroblast migration. Illustrative scheme of a parasagittal brain section of mice that received intravenous injections of Mac-1–SAP or rat IgG–SAP. At the end of the surgery, BrdU (150 mg kg−1, i.p.) was administered and neuroblast distribution was assessed within a 4–7 d interval. a, In control mice, microglia (EGFP, green) are present in the SVZ (inset) and intermingle with well arranged chains of migrating neuroblasts (DCX, magenta). Dividing cells (BrdU+, red) were observed along the migratory chains (b). c, In contrast, in microglia-depleted mice, CX3CR1-EGFP+ cells were absent (inset), and DCX+ cell distribution was disrupted. This led to a loss of the neuroblast chain unidirectionality, which was associated with a superposition of cell nuclei. Furthermore, the majority of BrdU fragments were associated with pyknotic nuclei (d). After 7 d, relatively few BrdU+ cells were observed in the most anterior portion of SVZ of control animals, abutting the RMS (f, white arrows). This pattern differed significantly from that of Mac-1–SAP-injected mice (IgG–SAP: 1 ± 0.4 cell; Mac-1–SAP: 36 ± 9 cells; mean ± SEM; p = 0.0018; unpaired t test; e), in which the SVZ contained a larger number of BrdU fragments (i, white arrows). Within the RMS of control animals, we noted BrdU+ neuroblasts (g, white arrowheads) and only few BrdU+ fragments (indicated by white arrows, depicted in optical section). In contrast, in microglia-depleted mice, we observed an accumulation of BrdU+ fragments (j, white arrows), that were not engulfed by microglia (white arrows in the inset). However, the number of BrdU+ cells and fragments were not significantly different (g) (rat IgG–SAP: 14 ± 2 cells; Mac-1–SAP: 26 ± 6 cells; mean ± SEM; p = 0.0605; unpaired t test) (e). Within the glomerular layers, we observed a decrease in the number of BrdU+ cells that reached these layers in Mac-1–SAP injected mice (k, white arrows), that proved statistically different from control animals (h), in which we observed BrdU+/EGFP+ cells (white arrows) and few BrdU+/EGFP− cells (white arrowhead) (rat IgG–SAP: 58 ± 6 cells; Mac-1–SAP: 14 ± 3 cells; mean ± SEM; p < 0.00001; unpaired t test) (e). lv, Lateral ventricle; Str, striatum; WM, white matter. Scale bars: 10 μm.

