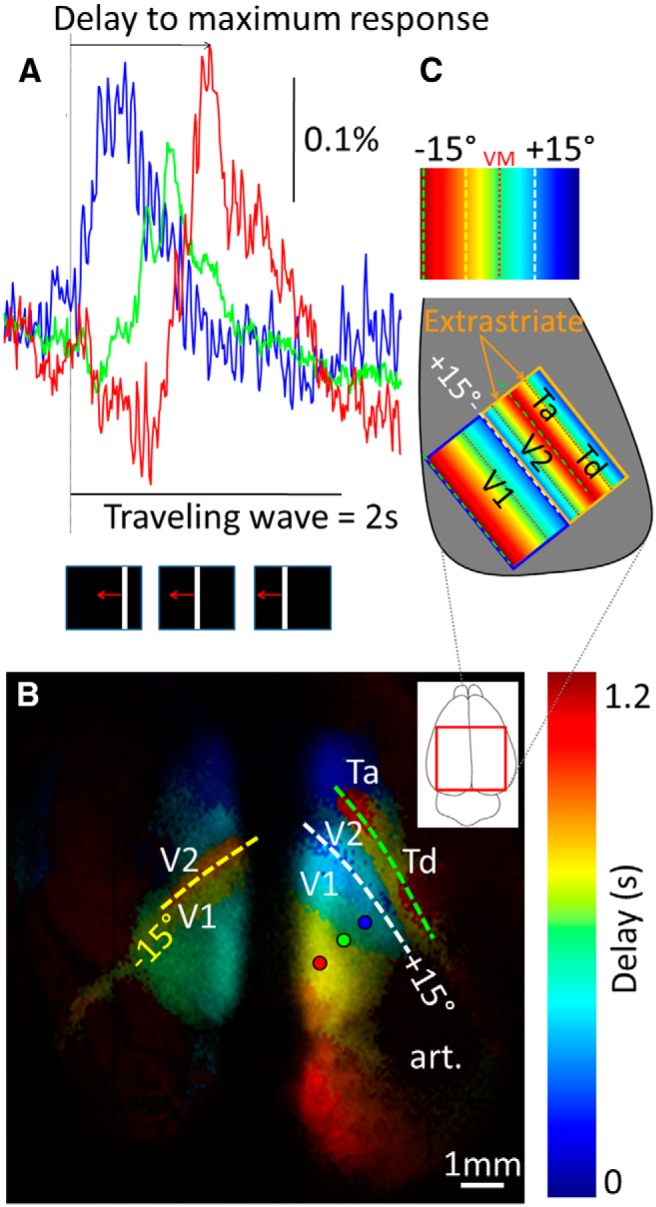
Figure 1.

Retinotopic mapping. A, Left, Responses to a moving bar recorded in the three cortical locations indicated in B (blue, green, and red circles). The bottom inset shows the visual stimulus. B, Map of delay (time-to-peak) to reach the maximum response. Scale bar, 1 mm. C, Diagram showing the correspondence between visual field and the cortical retinotopy. Art, Artifact where the dye did not stain this location.
