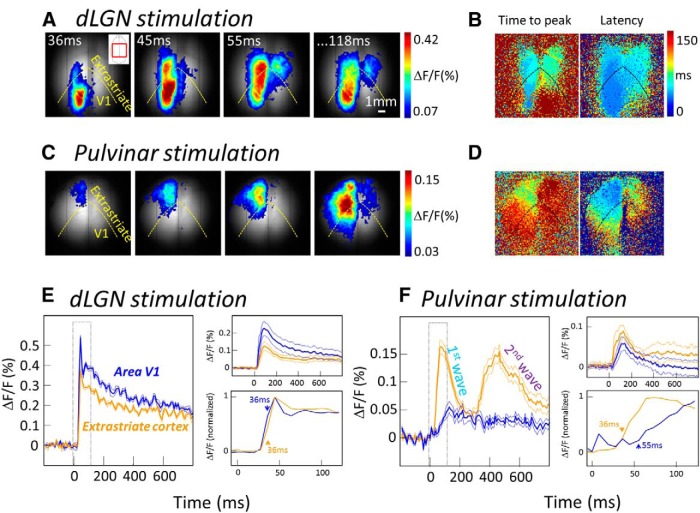
Figure 2.
Cortical activation evoked by dLGN and pulvinar stimulation. A, Example of averaged (between trials) cortical response maps (in color) overlaid on the basal fluorescence (in gray level) after stimulation of the left dLGN. B, Time-to-peak and latency maps of responses evoked after dLGN stimulation. C, D, Same as A and B but for stimulation of the Pv subdivision of pulvinar. E, Left, Fluorescence time course within area V1 (blue lines) and extrastriate cortex (thick orange lines) in response to dLGN stimulation. Right, Top, Averaged responses across recordings of the whole dataset. Right, Bottom, Normalized time close-up of the responses. Arrows indicate onset latency. F, Same as E but for pulvinar stimulation.

