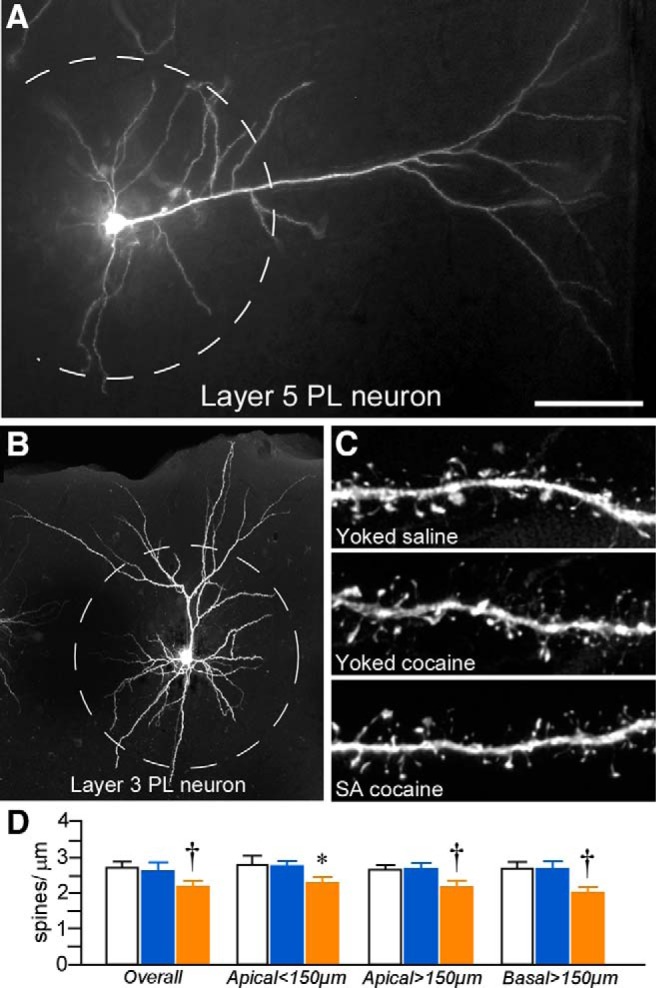
Figure 3.

A, Epifluorescence photomicrograph depicting a deep layer 5 PL neuron injected with fluorescent dye (Lucifer yellow). B, 3D digital reconstruction of a dye-filled layer 3 PL neuron. The dashed lines in each image represent a radius of 150 μm that was used to partition the apical dendritic tree for spine density quantification (i.e., proximally or distally) as a function of treatment group. C, High-resolution 3D digital images of deconvolved dendritic segments labeled with the fluorescent dye Lucifer yellow illustrating the anatomical detail for spine morphometric analyses. Scale bars: A, 150 μm; B, 100 μm; C, 10 μm. D, Mean ± SEM dendritic spine density in PL neurons as a function of treatment group. Self-administered (SA) cocaine rats showed selective decreases in spine density relative to both yoked groups. *p < 0.05 relative to yoked-saline-treated group; †p < 0.05 relative to yoked-saline and cocaine-treated groups. n = 11 yoked-saline; n = 11 yoked-cocaine; n = 12 SA cocaine.
