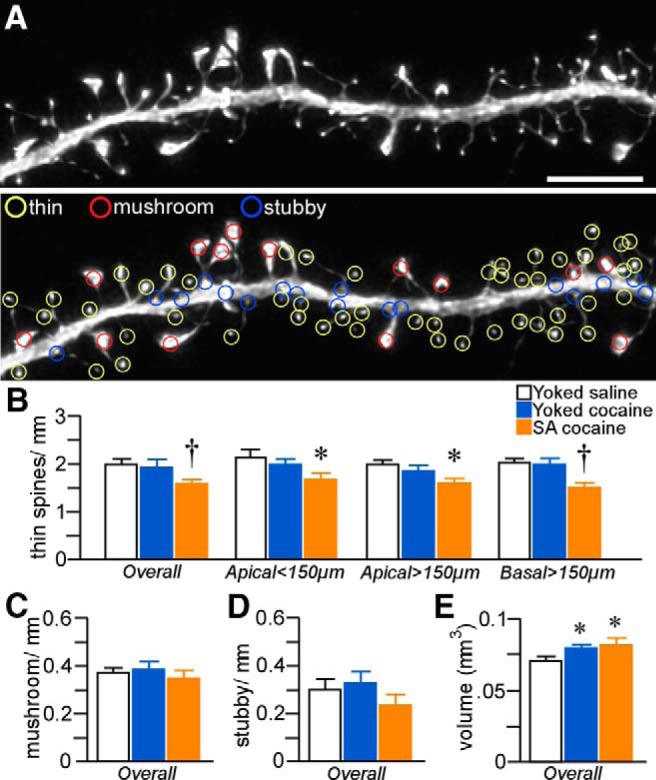
Figure 4.

A, Example of high-resolution deconvolved optical z-stack of a dendritic segment used for spine analysis with NeuronStudio software. Open colored circles represent spine subtypes based upon user-defined parameters in the software. Scale bar, 5 μm. Histograms show cocaine treatment effects on thin (B), mushroom (C), and stubby (D) spine density in pyramidal neurons in layers 2/3 and 5 of PL. Thin spine subtypes are reliably decreased only in rats in the self-administered (SA) cocaine group. E, Mean ± SEM of spine volume as a function of treatment status. Cocaine administration (contingnent and noncontingent) produced generalized increases in this measure. *p < 0.05 relative to yoked-saline group; †p < 0.05 relative to yoked-saline and cocaine-treated groups. n = 11 yoked-saline; n = 11 yoked-cocaine; n = 12, SA cocaine.
