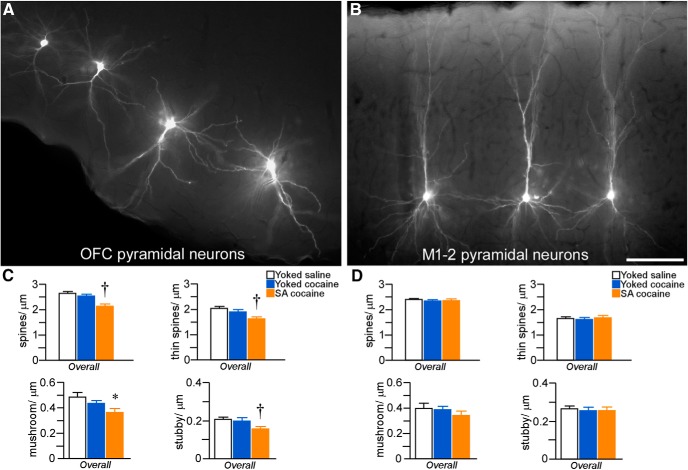
Figure 6.
A, B, Epifluorescence photomicrographs depicting several pyramidal neurons filled with Lucifer yellow in the LO and M1–2. Scale bar, 100 μm. C, Mean ± SEM dendritic spine and subtype densities in LO neurons as a function of treatment group. Self-administered (SA) cocaine rats showed generalized decreases in spine density and subtypes compared with yoked counterparts. *p < 0.05 relative to yoked-saline group; †p < 0.05 relative to yoked-saline and cocaine-treated groups. n = 3 yoked-saline; n = 5 yoked-cocaine; n = 5 SA cocaine. D, Mean ± SEM dendritic spine and subtype densities in M1–2 neurons as a function of treatment group. n = 3 yoked-saline; n = 3 yoked-cocaine; n = 5 SA cocaine.

