Figure 3.
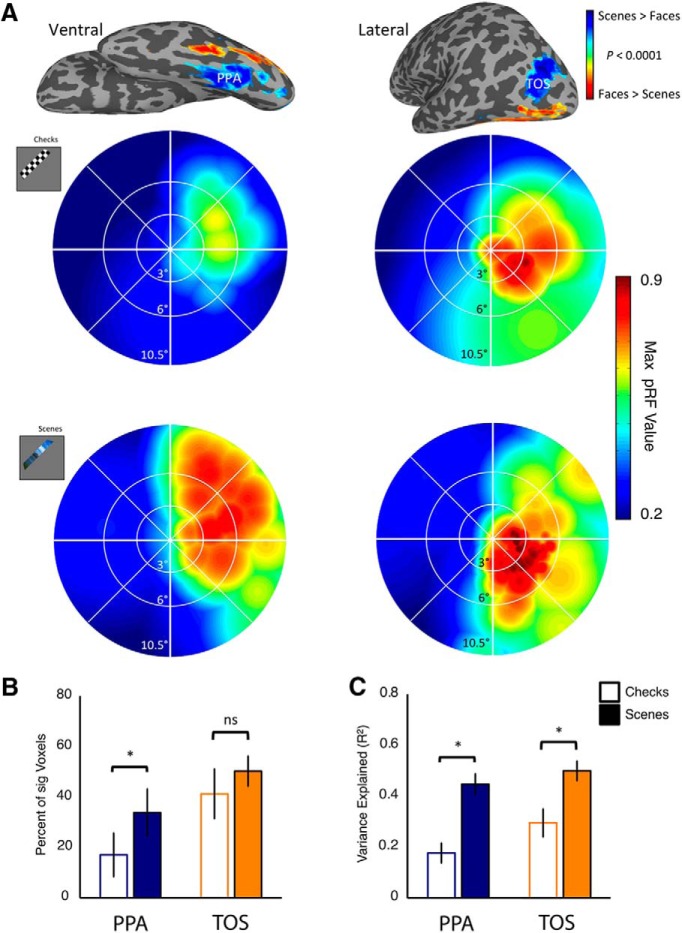
Comparison of checkerboard and scene pRF mapping. A, Example checkerboard and scene pRF data in a single participant. The top row shows the ventral (top left) and lateral (top right) surface reconstructions of the left hemisphere of a single participant overlaid with the group-averaged contrast of scenes minus faces (p < 0.0001, uncorrected). The group PPA (ventral) and TOS (lateral) are labeled. The middle row shows visual field coverage plots given in pRF value elicited by checkerboards for the left PPA (left) and left TOS (right) of a single participant. A bias for the contralateral upper visual field is evident within PPA, and a bias for the contralateral lower visual field is present within TOS. The bottom row shows visual field coverage plots, elicited by our scenes in the same participant. The biases are consistent with those elicited by checkerboards; however, there is a far higher pRF value across the visual field, particularly within left PPA. B, Percentage of voxels within each ROI, collapsed across hemispheres, modulated significantly (p < 0.001, uncorrected) by both mapping stimuli in the seven participants who completed both sessions. Scene pRF mapping led to a substantial increase in the proportion of significant voxels relative to checkerboards in both ROIs; (*p < 0.05). C, Mean explained variance in both ROIs elicited by both mapping stimuli. In both ROIs, scene pRF mapping captures significantly more variance than its checkerboard mapping counterpart (*p < 0.05). Error bars in this and all plots represent the between-subjects SEM.

