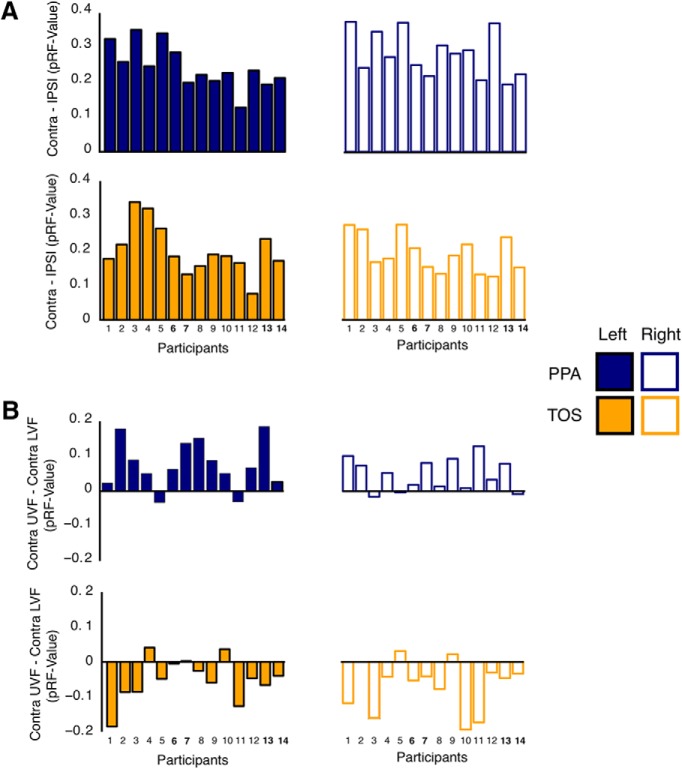
Figure 5.
Individual participant visual field biases. A, Bars depict the contralateral bias [Contra minus Ipsi (pRF value)] for each participant and ROI. Across ROIs, every participant exhibited the predicted bias for the contralateral visual field. B, Bars depict the elevation bias [Contra upper minus Contra lower (pRF value)] for each participant and ROI. A contralateral UVF bias (positive value) was present in 12 of 14 and 11 of 14 participants for the left and right PPA, respectively. In contrast, a contralateral LVF bias (negative value) was present in 11 of 14 and 12 of 14 participants for the left and right TOS, respectively. Bold numbers in A and B highlight the 7T participants. Participant numbers correspond to the order in which participants were scanned.

