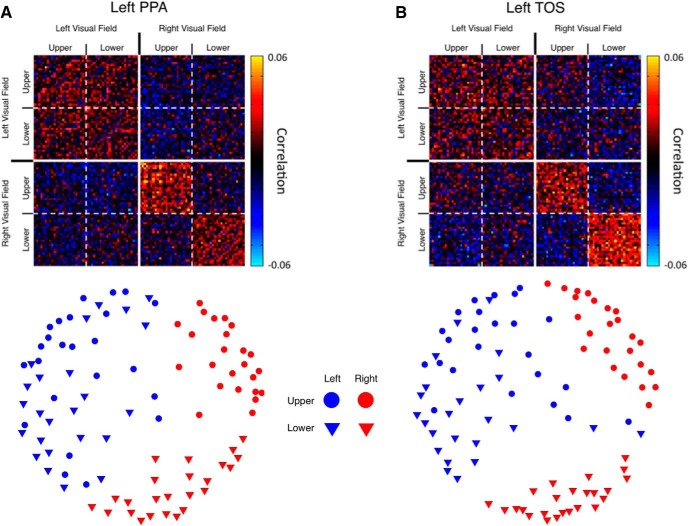
Figure 8.
Similarity matrices for quadrant data. A, Top, Group-averaged raw similarity matrix for the left PPA. The matrix is 96 × 96 (24 scenes × 4 positions), with each point representing the correlation between a pair of conditions across two independent halves of the data. The correlation between a condition and itself are plotted along the main diagonal from the top left to bottom right corner. Solid lines demarcate borders between hemifields, whereas dashed lines show the borders between the upper and lower visual fields. Negative and positive correlations are well grouped by quadrant, indicating that position is a strong determinant of the pattern of responses. Bottom, Multidimensional scaling (MDS) plot of the left PPA matrix shown above. In this plot, each symbol represents a single condition, and the distances between symbols reflects the correlation between conditions. Note the strong grouping by visual hemifield and the strong grouping by elevation, particularly for the contralateral (red symbols) conditions. B, Top, Raw similarity matrix for left TOS. Bottom, MDS plot for left TOS.

