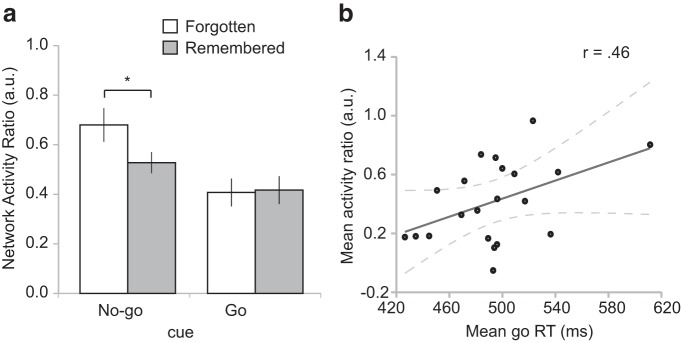
Figure 3.
No-go/go network activity ratio in relation to subsequent memory and performance in the go/no-go task. a, The mean trial-by-trial ratio of no-go over go network activation, reflecting inhibitory resource demand, was significantly higher for no-go cues that were later forgotten than those that were later remembered. Error bars indicate SEM. * p ≤ 0.05. b, Greater relative engagement of the no-go over go network was also associated with slowed responding to go cues across subjects. Dashed lines indicate the 95% CI for the regression line.

