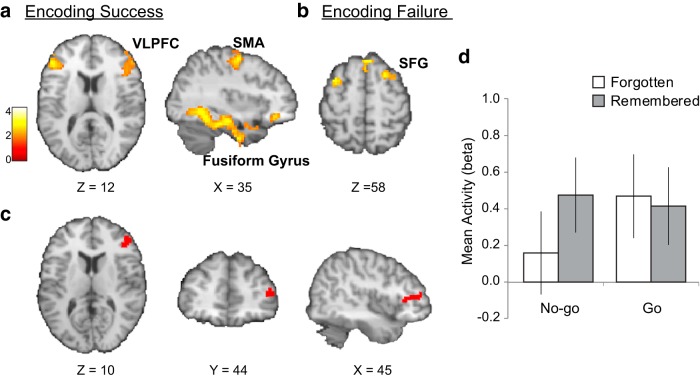
Figure 4.
Memory encoding in relation to inhibitory demands. Brain regions associated with (a) encoding success and (b) encoding failure for no-go cues were identified via the conventional difference in memory analysis (whole-brain corrected to α < 0.01). c, Of the regions identified in a, voxels within the right VLPFC exhibited an inverse trial-by-trial relationship with the index of inhibitory demand (i.e., no-go/go network activity ratio), reflecting sapped resources during the encoding of subsequently forgotten no-go cues. d, Bar graph illustrating mean activity (β) during go/no-go trials as a function of subsequent memory across all voxels in the cluster shown in c. Image display according to neurological convention (left is left).

