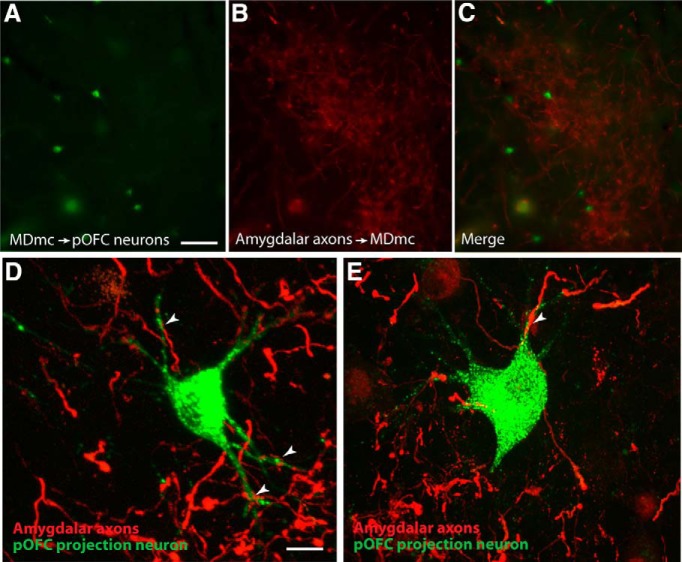
Figure 2.
In MDmc, neurons projecting to pOFC overlapped with amygdalar axons. A–C, Neurons in MDmc projecting to pOFC (left), overlapped with patches of labeled amygdalar axons (middle), as seen in the merged images (right). Scale bar in A is 100 μm and applies to A–C. D, E, Laser scanning confocal microscopy showing close appositions (white arrowheads) between pOFC projection neurons (green) and amygdalar axons (red) in MDmc. Scale bar in D is 20 μm and applies to D and E.

