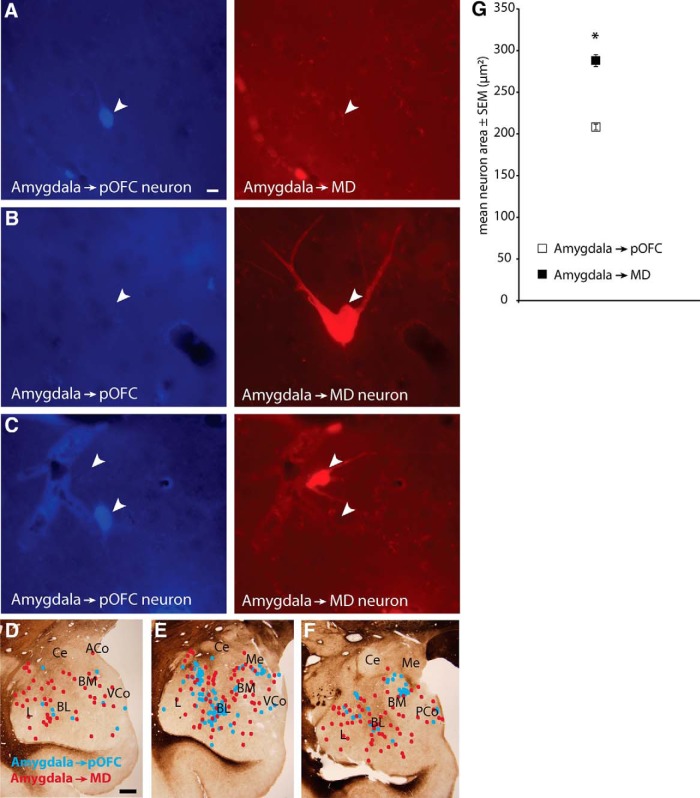
Figure 5.
Amygdalar neurons that project to MD and to pOFC are distinct. A, Amygdalar neuron is labeled with tracer injected in pOFC (left, blue, white arrowhead), but is not labeled with tracer from MD (right). Scale bar in A is 10 μm and applies to A–C. B, Amygdalar neuron is labeled with tracer injected in MD (right, red, white arrowhead), but is not labeled with tracer from pOFC (left). C, Neurons in the same field show that different neurons in the amygdala were labeled retrogradely with tracer from pOFC (left, bottom arrowhead) or from MD (right, top arrowhead); neither neuron is double-labeled. D–F, Representative coronal sections from fresh tissue through the amygdala (anterior → posterior) show spatial overlap of projection neurons directed to MD (red dots) or pOFC (blue dots). Scale bar in D is 1 mm and applies to D–F. G, Mean area of labeled amygdalar projection neurons directed to MD was significantly larger than for projection neurons directed to pOFC. Vertical lines indicate SEM.

