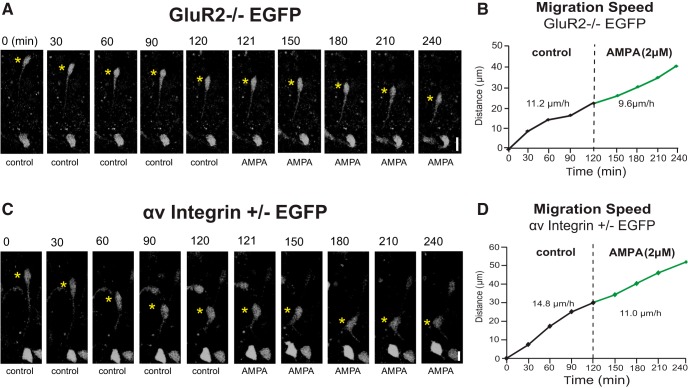
Figure 5.
OPCs that were null for GluR2 or deficient in αv integrin did not accelerate their migration rate in response to AMPA in P4 cerebellum. A, Time-lapse images of OPC migration in P4 cerebellum from GluR2−/− PLP-EGFP mouse. Yellow asterisks mark the soma of OPC. The elapsed time is indicated above each image. Application of AMPA (2 μm) did not accelerate the migration of GluR2−/− OPCs. Scale bar, 15 μm. B, Sequential changes in the total distance and calculated speed traveled during each 30 min of the testing period by the OPC soma shown in A were plotted as a function of elapsed time before and after application of 2 μm AMPA. C, Time-lapse images representing OPC migration in the cerebellum of P4 αv integrin+/− PLP-EGFP mice. Application of AMPA (2 μm) did not accelerate the migration of αv integrin+/− OPCs. Scale bar, 10 μm. D, Sequential changes in the total distance and average calculated speed traveled during each 30 min of the testing period by the OPC soma shown in C were plotted as a function of elapsed time before and after application of 2 μm AMPA.

