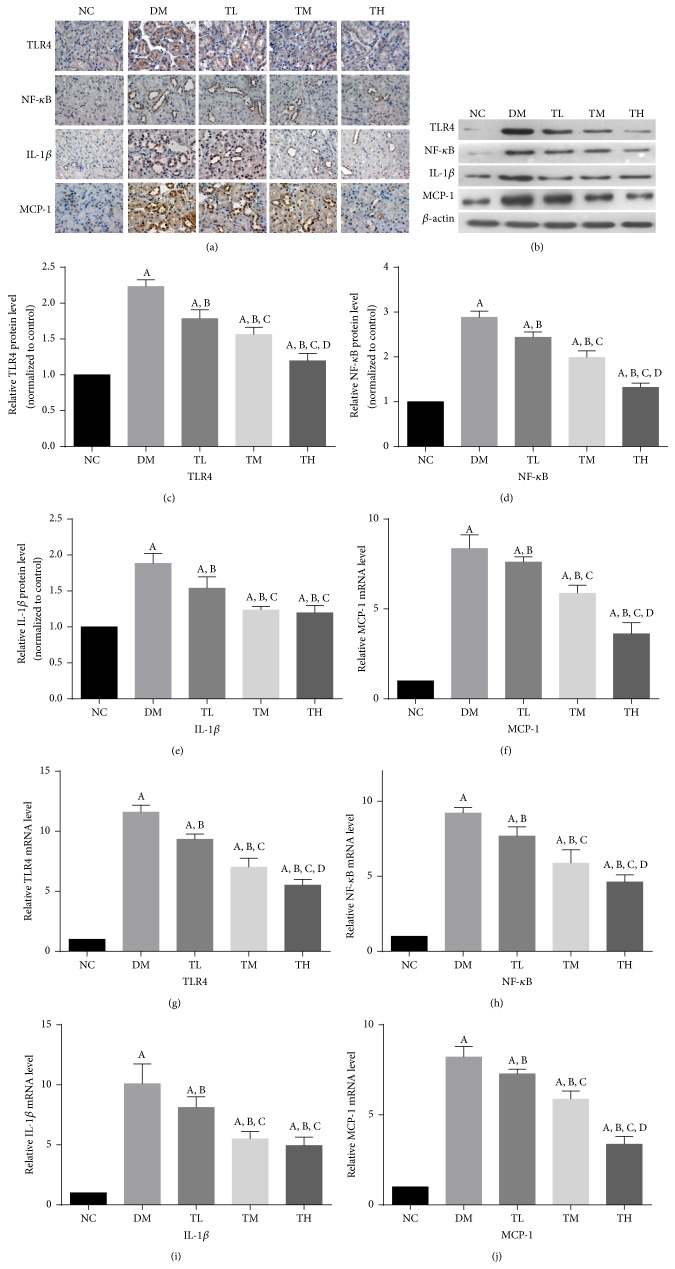
Figure 3.
TGT attenuated diabetes-induced renal inflammation. (a) Immunostaining of TLR4, NF-κB, IL-1β, and MCP-1 was shown for different groups. (b) Representative western blotting analysis of TLR4, NF-κB, IL-1β, and MCP-1 was shown for different groups. (c–f) Densitometric results of TLR4, NF-κB, IL-1β, and MCP-1, as determined by western blot. (g–j) The mRNA expressions of TLR4, NF-κB, IL-1β, and MCP-1 were shown for different groups. NC: normal control; DM: diabetic rats without drug treatment; TL: low-dose TGT (1 mg/kg/day); TM: medium-dose TGT (3 mg/kg/day); TH: high-dose TGT (6 mg/kg/day). A p < 0.05 versus NC group, B p < 0.05 versus DM group, C p < 0.05 versus TL group, and D p < 0.05 versus TM group.

