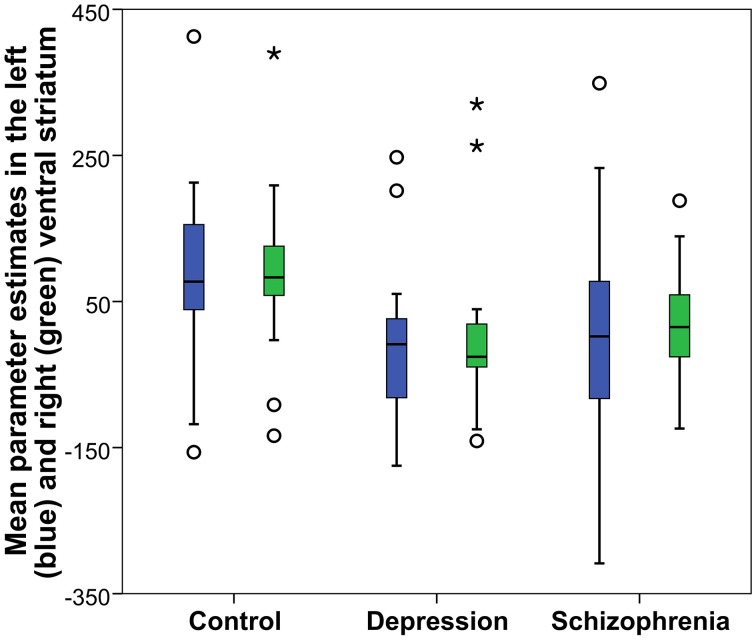
Figure 5.
Reward anticipation mean parameter estimates in the accumbens nucleus: Obtained from the right and left significant clusters (p < 0.05 FWE cluster corrected after a cluster-inducing threshold of Z > 3 within a ventral striatum ROI) in the between groups One-Way ANOVA of the first level contrast comparing reward and neutral cues. Parameter estimates are arbitrarily scaled values. Central line represents the median value (second quartile, Q2) and the box borders indicate the 1st (Q1), and 3rd quartile (Q3). Hence, the total length of the box is the interquartile range (IQR). Whiskers mark last value in the sample located between the 1.5 × IQR below Q1 and 1.5 × IQR above Q3. Circles represent data between the 1.5 and 3 × IQR below Q1 or above Q3, whereas asterisks are data further apart from the median.

