
FIGURE 5.
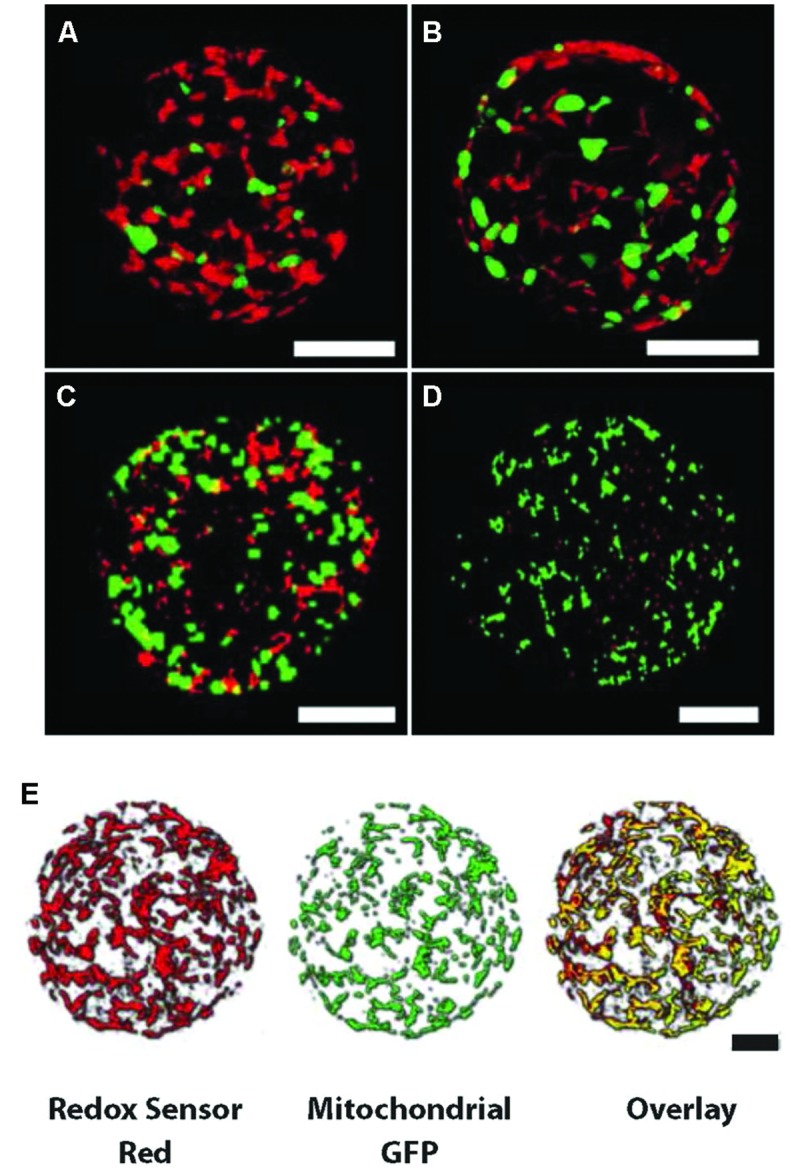
Mitochondria expressing GFP labeled with Redox Sensor Red (RSR) show a decrease in number as ROS levels decrease during protoplast culture. (A–D) Confocal projection images of Nicotiana protoplasts incubated for 6 h in RSR, clockwise from top left; 24, 48, 72, and 96 h. The number of RSR (red) stained mitochondria become fewer as ROS levels decrease (also see Supplementary Figure S4). Green represents GFP-labeled mitochondria with no RSR staining. Bars = 20 μm (A–D). (E) Overlay of confocal images of both RSR and GFP (yellow) at the beginning of incubation showing most subcellar ROS arise from the mitochondria. Bars = 10 μm (E).