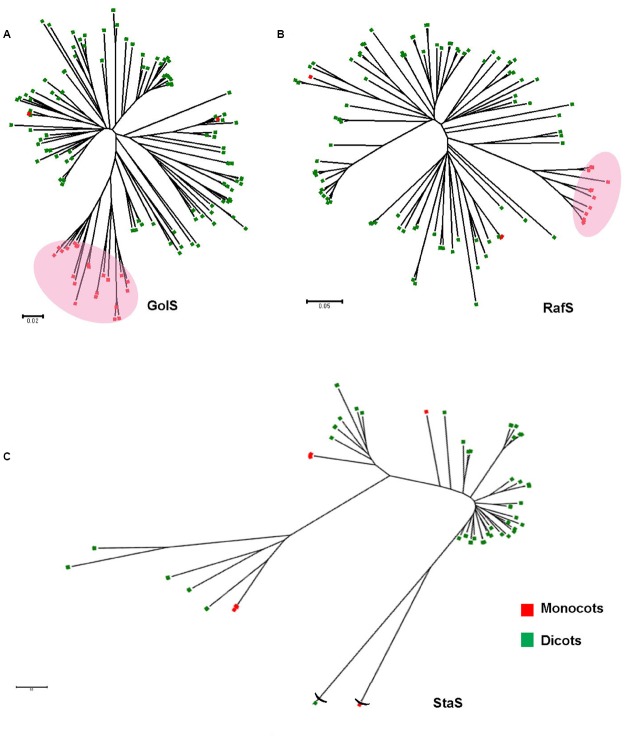
FIGURE 2.
The evolutionary relationships of taxa representing diversification of reported GolS (A), RafS (B), and StaS (C) protein sequences within the plant kingdom. The red blocks and green blocks represent monocot and dicot species, respectively. The evolutionary history was inferred using the Neighbor-Joining method. The optimal tree with the sum of variable branch length = 20.18266976 is shown. The tree is drawn to scale and bootstrap test was performed with 500 replicates, with branch lengths in the same units as those of the evolutionary distances used to infer the phylogenetic tree. The evolutionary distances were computed using the Poisson correction method and are in the units of the number of amino acid substitutions per site. The rate variation among sites was modeled with a gamma distribution (shape parameter = 1). The analysis involved 67/150/45 amino acid sequences. All ambiguous positions were removed for each sequence pair. Evolutionary analyses were conducted in MEGA6 (Zuckerkandl and Pauling, 1965; Felsenstein, 1985; Saitou and Nei, 1987; Tamura et al., 2013).

