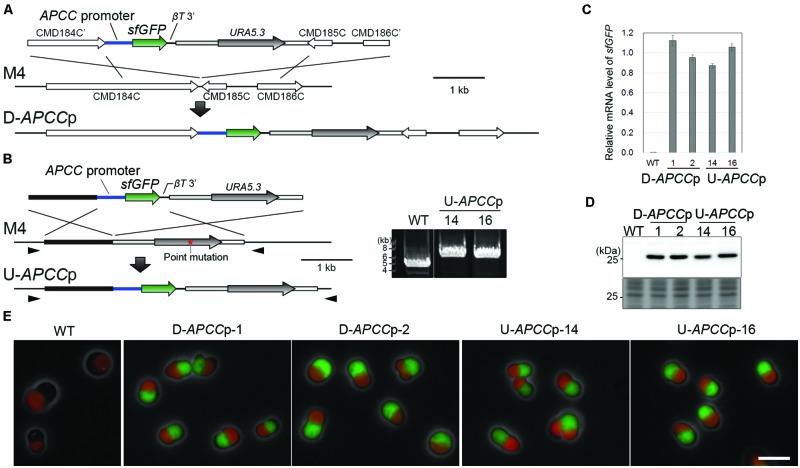
FIGURE 1.
Construction and characterization of stable strains expressing sfGFP from two distinct chromosomal neutral loci. (A) Schematic diagram of the sfGFP gene insertion into the intergenic region between CMD184C and CMD185C by homologous recombination. The first line indicates the introduced DNA fragment and the second line indicates the genomic structure of the parental strain M4. For the efficient expression of sfGFP, the 600-bp upstream flanking sequence of APCC orf (APCC promoter) and the 200-bp downstream flanking sequence of the β-tubulin orf (βT 3′) were utilized as a promoter and a putative polyadenylation signal sequence, respectively. The third line indicates the expected genomic structure of the stable transformant. (B) Schematic diagram of the sfGFP gene insertion into the upstream region of the URA5.3 gene by homologous recombination. The same set of the promoter and the putative polyadenylation signal sequence as in (A) was flanked with the sfGFP orf. The red asterisk indicates the position of a point mutation in URA5.3 gene in the strain M4. The arrowheads indicate the positions of the PCR primers No. 14 and No. 15 (the exact positions and sequences are indicated in Supplementary Table S1). The PCR analysis of the independent U-APCCp strains confirmed the homologous recombination events (right panel). The WT strain was used as a negative control. The predicted size of the PCR product is 5.9 kb for U-APCCp and 4.2 kb for the WT, respectively. (C) Quantitative RT-PCR analysis of the D-APCCp and U-APCCp strains to estimate the sfGFP mRNA levels. The WT strain was used as a negative control. The sfGFP mRNA level in each strain was normalized with the data of DRP3/CmDnm1, and the average of the values in the D-APCCp and U-APCCp strains was defined as 1.0. The bar indicates the standard deviation (n = 3). (D) Immunoblot analysis of the total cell lysates with the anti-GFP antibody. An image of a gel stained with Coomassie Brilliant Blue (CBB) is shown as a loading control. (E) Fluorescent micrographs showing sfGFP fluorescent signals detected in the D-APCCp and U-APCCp strains. Green, GFP; red, autofluorescence of chlorophyll; gray, phase-contrast. Scale bar = 5 μm.

