FIGURE 3.
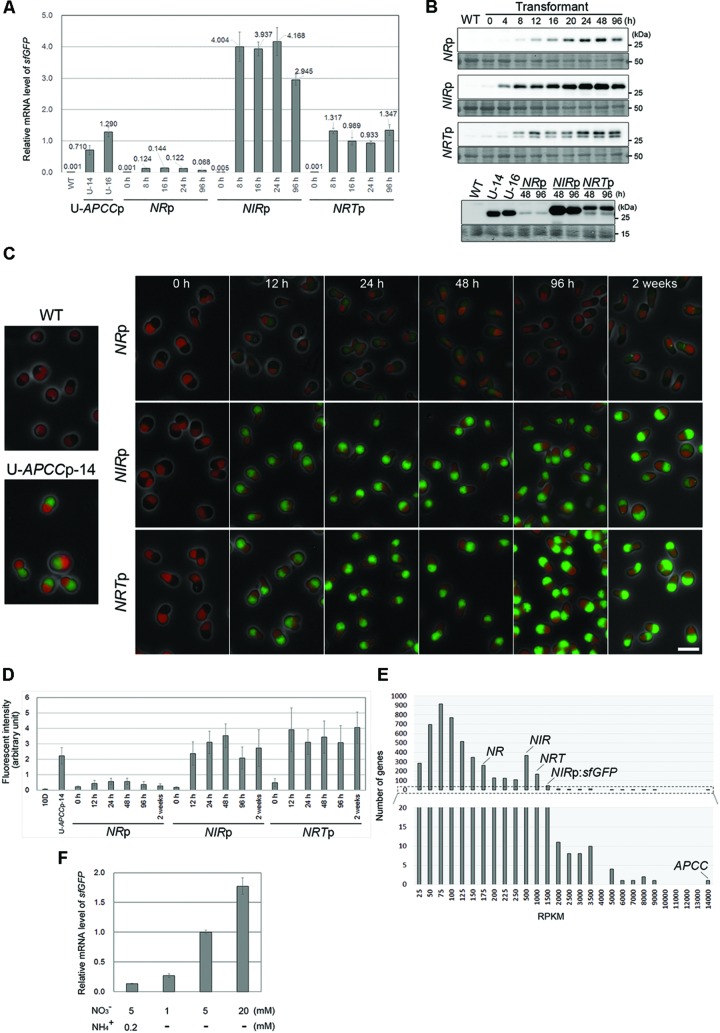
The induction of sfGFP expression by medium exchange in the NRp, NIRp, and NRTp strains. (A) Quantitative RT-PCR analyses showing the change in the sfGFP mRNA level in the NRp, NIRp, and NRTp strains before and after the exchange from the ammonium medium to the nitrate medium. The values were standardized by the average of the U-APCCp-14 and U-APCCp-16 which were cultured in the ammonium medium. The WT strain was used as a negative control. The time elapsed since the medium exchange is indicated below the graph and the time point 0 is just before the medium exchange. The bar indicates the standard deviation (n = 3). (B) Immunoblot analysis of the total cell lysates of the respective strains with the anti-GFP antibody. The upper panel shows the change in the sfGFP protein level just before (0 h) and after the medium exchange. The WT strain was used as a negative control. The lower panel compares the sfGFP protein level of the respective strains after the medium exchange. The sfGFP level in the U-APCCp strains (stably expressing GFP in both the ammonium and nitrate media: the results in the ammonium medium shown) is also shown as an index of the protein level. The WT strain was used as a negative control. An image of the PVDF membrane stained with Ponceau S is shown as a loading control. Two bands were detected in the NRTp strain with the anti-GFP antibody, most likely because there are two translational start sites. (C) Fluorescent micrographs showing the change in the level of the sfGFP fluorescent signal just before (0 h) and after the medium exchange. The green fluorescence of sfGFP was overlaid with the phase-contrast image and autofluorescence of the chloroplast. The WT and the U-APCC strain were used as a positive and a negative control, respectively. The exposure time to capture the sfGFP signal was 1 s for all images. Green, GFP; red, autofluorescence of chlorophyll; gray, phase-contrast. The scale bar = 5 μm. (D) The change in the intensity of sfGFP fluorescence in cells in (C). The bar indicates the standard deviation (n = 15). (E) RNA-seq analysis showing the relative mRNA levels of endogenous NR, NIR, and NRT in the transcriptome of the NIRp strain (logarithmic growth phase) cultured in the nitrate medium. The reads per kilo-base (RPKM) data indicates the relative mRNA abundance. The RPKM of endogenous NR, NIR, NRT, APCC, and sfGFP transcription of which is driven by the NIR promoter, was 158, 377, 787, 13384, and 1337, respectively. The lower histogram shows the magnification of the range from 0 to 20. (F) QRT-PCR analyses showing the sfGFP mRNA level in the NRTp strain 16 h after the medium exchange. The values were standardized by the data from culture in medium containing 5 mM nitrate without ammonium. The concentration of nitrate or ammonium is indicated below the graph. The bar indicates the standard deviation (n = 3).

