FIGURE 4.
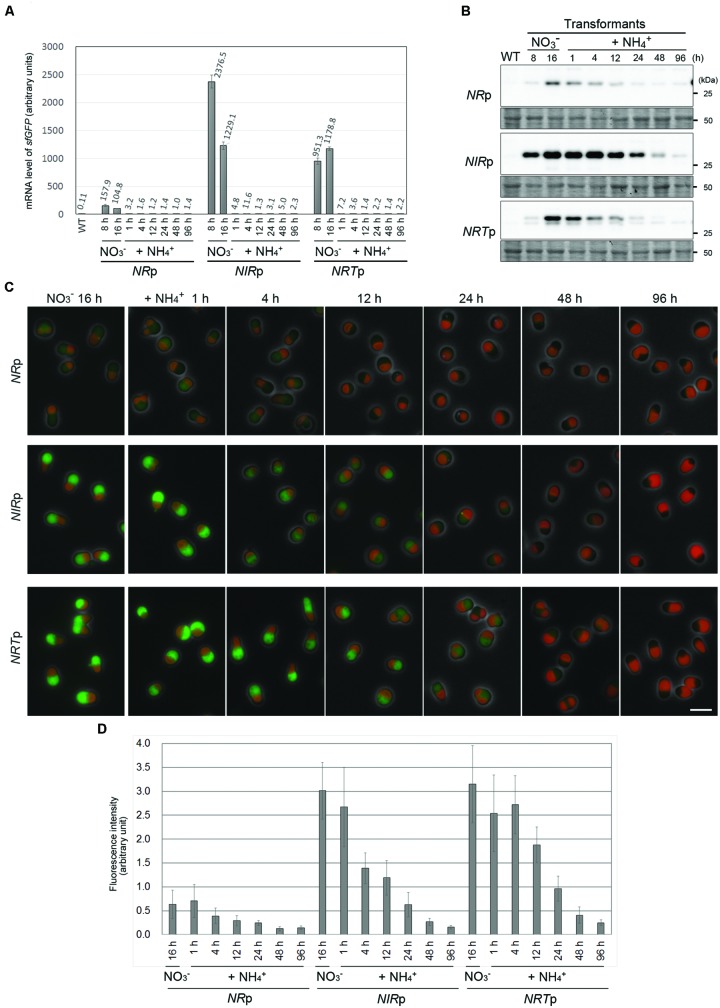
The suppression of sfGFP expression by the addition of ammonium in the NRp, NIRp, and NRTp strains. (A) Quantitative RT-PCR analyses showing the change in the sfGFP mRNA level in the NRp, NIRp, and NRTp strains before and after the addition of ammonium. The values in the respective stains were normalized with the data of DRP3/CmDnm1. The WT strain was used as a negative control. After cultivation of the cells in the nitrate medium for 16 h, ammonium was added to the medium and then the cells were cultured for 96 h. The bar indicates the standard deviation (n = 3). (B) Immunoblot analysis of the total cell lysates of the respective strains with the anti-GFP antibody showing the change in the sfGFP protein level before and after the addition of ammonium. An image of the PVDF membrane stained with Ponceau S is shown as a loading control. (C) Fluorescent micrographs showing the change in the level of the sfGFP fluorescent signal before and after the addition of ammonium. The exposure time to capture the sfGFP signal was 1 sec for all images. Green, GFP; red, autofluorescence of chlorophyll; gray, phase-contrast. The scale bar = 5 μm. (D) The change in the intensity of sfGFP fluorescence in cells in (C). The bar indicates the standard deviation (n = 15).

