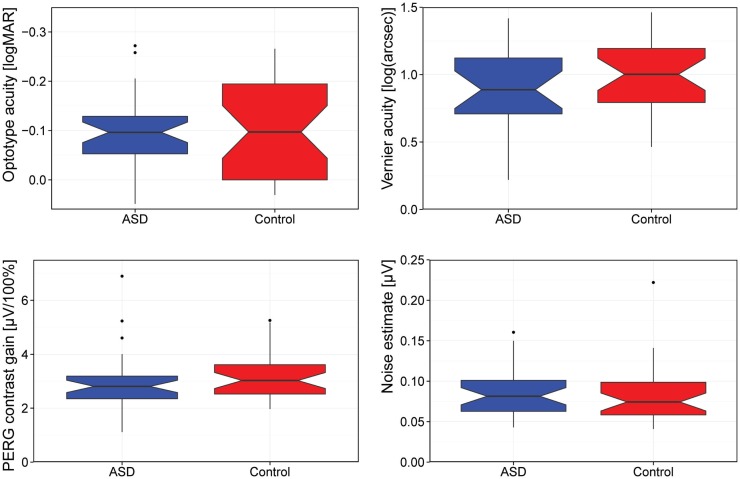
Figure 1.
Comparison of visual acuity (logMAR), Vernier acuity [log(arcseconds)], contrast gain, and background noise. [Box-plot details: the median is indicated by the thick horizontal lines, the notches represent a 95% confidence interval for the medians, the box covers the 25–75% percentile range, the “antennas” indicate the range, and the outliers (1.5 times the interquartile distance beyond the quartiles) are indicated by circles.]

