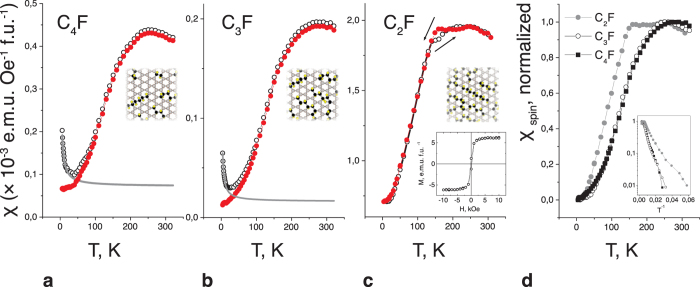
Figure 2. Magnetic susceptibility of the CnF samples.
(a,b) Raw data from the C4F (a) and C3F (b) samples measured at an applied magnetic field of 100 Oe upon being heating after zero-field cooling (open circles); the same curves with the Curie contribution (grey) subtracted are represented by filled red circles. (c) Raw data from a C2F sample measured upon heating (filled circles) and upon cooling (open circles); inset: room-temperature M(H) loop. (d) Normalized spin susceptibilities for C4F, C3F and C2F samples; inset: spin susceptibility vs reciprocal temperature for these samples.

