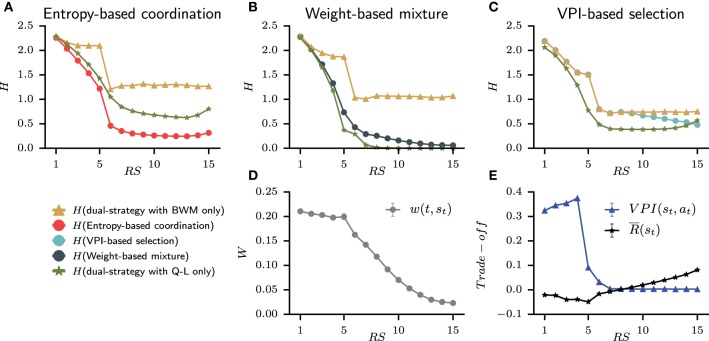
Figure 9.
Average contribution at each representative steps of the goal-directed and habitual strategy for each model from the set of best model. (A–C) For each model, the contribution is evaluated by removing Q-values from one strategy and comparing the resulting entropy H of probability of action. The green triangle line is the final entropy from the dual-strategy with BWM only. The yellow star line is the final entropy from the dual-strategy with Q-L only. Also plotted with circles is the final entropy of the full model (i.e., BWM+Q-L). (D) The weight from the Weight-based mixture model that shows the reliability of BWM over QL. (E) The speed-accuracy trade-off of the VPI-based selection shows a switch of strategy around trial 8.

