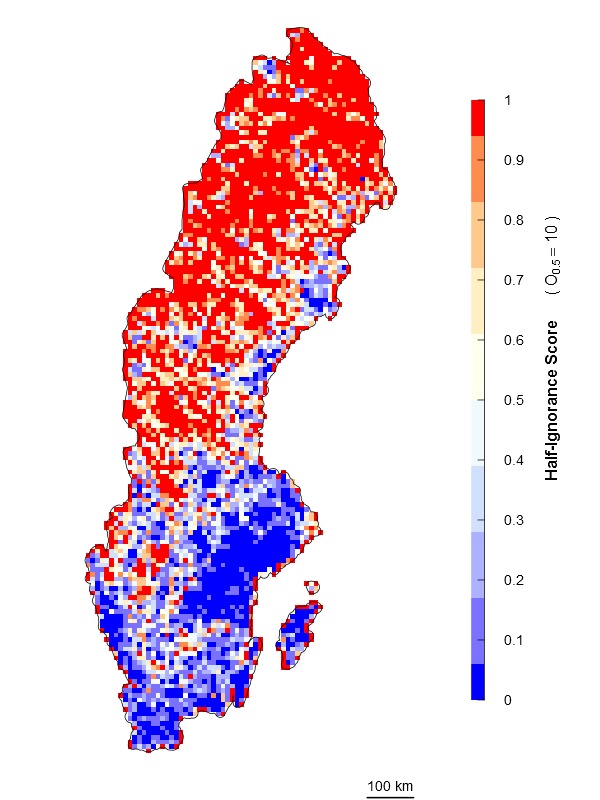
Raw observations (a; Suppl. material 1) and ignorance maps (b,c,d,e,f) for the superfamily Papilionoidea over Sweden for the period 2000-2014, produced with the three proposed algorithms. The inset in panel 3a. shows Sweden in Europe. The black contour shows a 10 km buffer around Sweden’s land surface. Grid resolution is 10 x 10 km. Panels 3d,e,f: O0.5 = 1, 5, and 10; respectively.
Figure 3a.
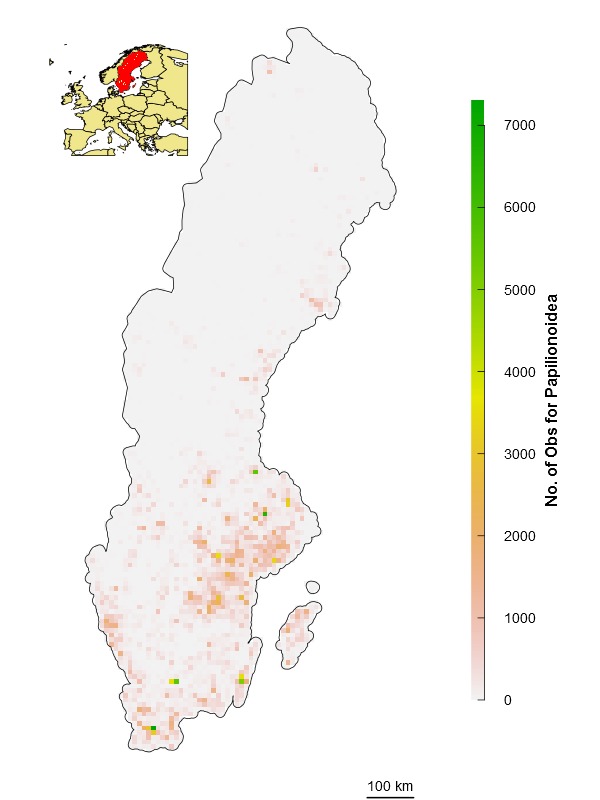
Figure 3b.
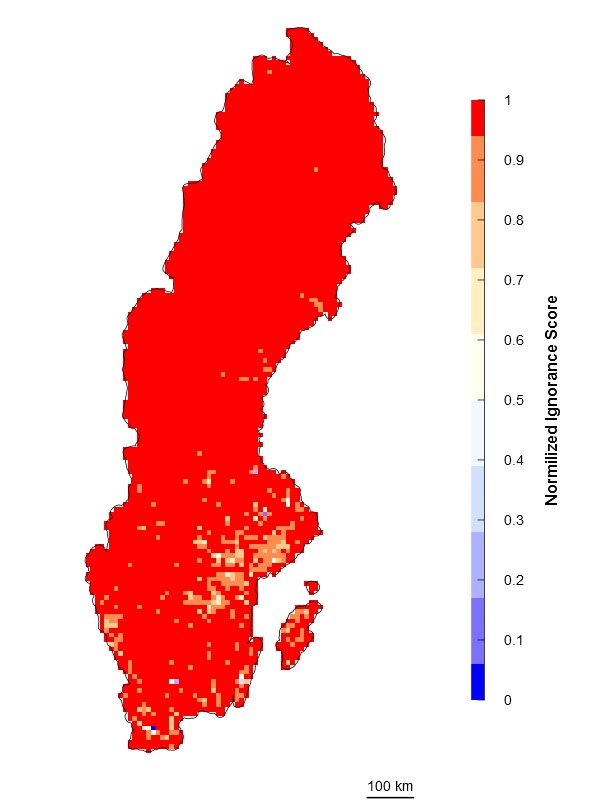
Figure 3c.
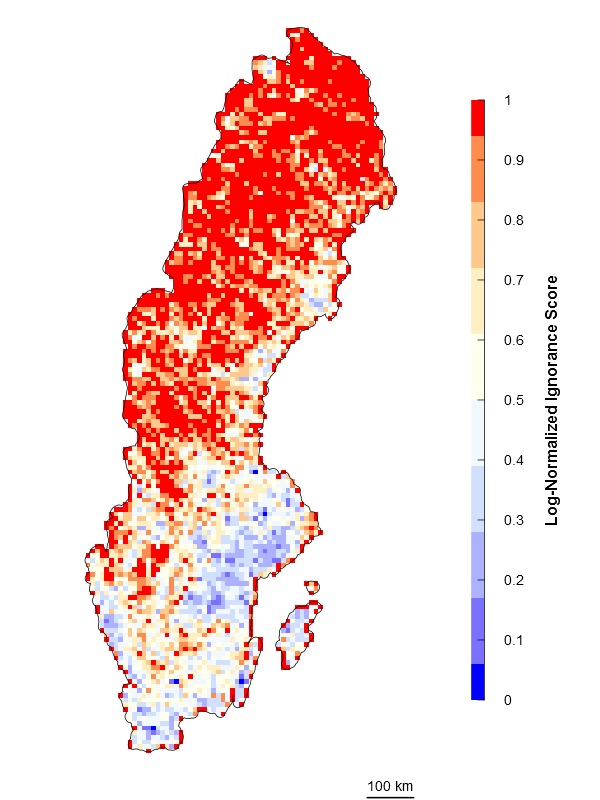
Figure 3d.
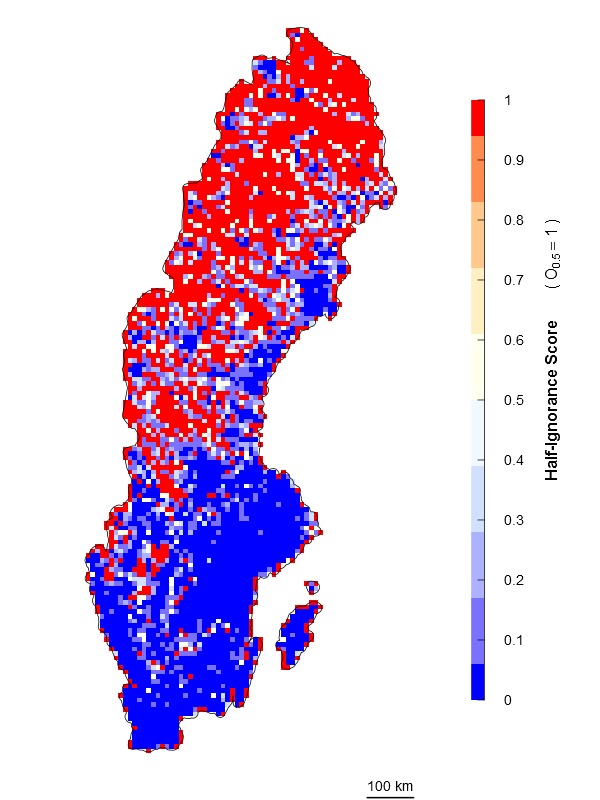
Figure 3e.
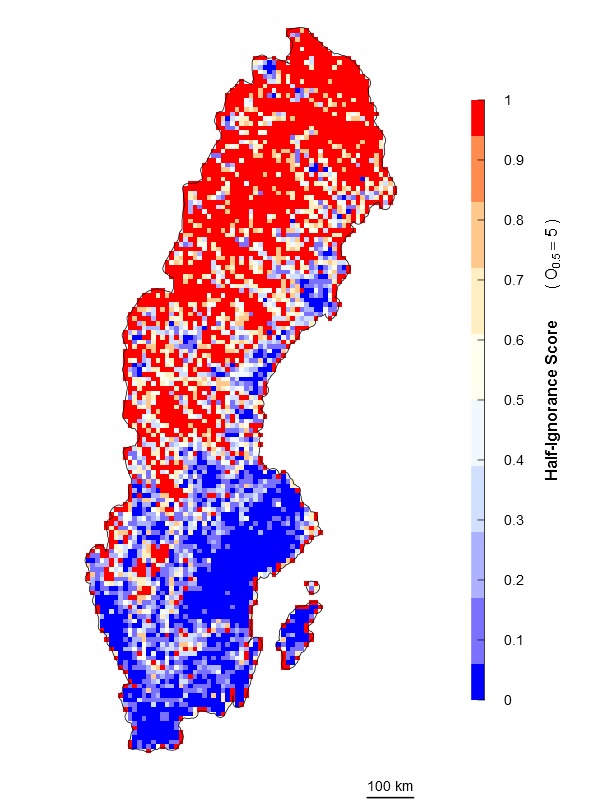
Figure 3f.
