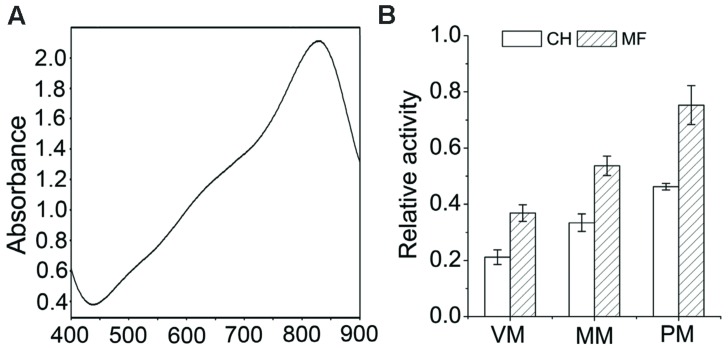
FIGURE 2.
Enrichment assessment of various subcellular membranous components. (A) Wavelength scanning of reaction system of H+-ATPase activity determination at a wavelength of 400–900 nm. (B) Enzymatic characterization of the membrane fraction. Relative H+-ATPase activity was determined by measurement of membrane-specific H+-ATPase activity compared to total ATPase activity. MF, membrane fraction; CH, crude homogenate; VM, vacuole membrane; PM, plasma membrane; MM, mitochondria membrane. Data are means ± SD of three independent experiments (biological replicates).

