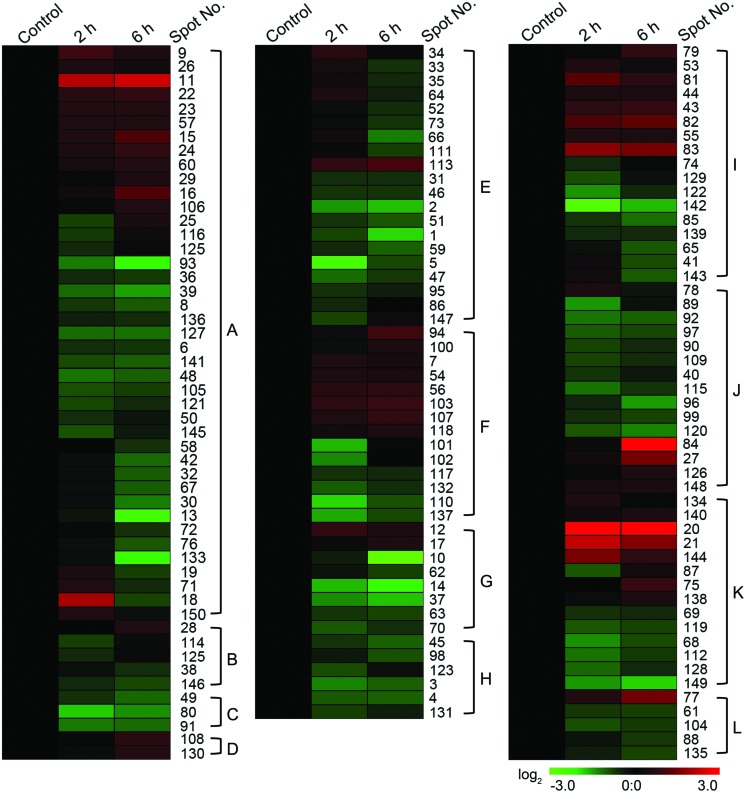
FIGURE 5.
Hierarchical clustering of membrane proteins of all 12 categories in control and two different CHA-SQ-1 treatment regimes of wheat flag leaves. The hierarchical cluster analysis was conducted using MultiExperiment Viewer 4.9 and the Log-transformed values of -fold change ratios listed in Supplementary Table S4. A, photosynthesis; B, signal transduction; C, protein transport; D, chlorophyll biosynthesis; E, ATP synthesis and ion transport; F, protein biosynthesis; G, electron transport; H, protein degradation; I, protein folding and assembly; J, unclassified proteins; K, cell rescue and defense; L, carbohydrate metabolism.

