
Figure 2.
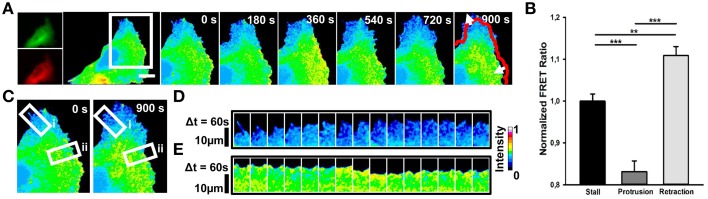
Spontaneous RhoA dynamics in NG108-15 cells. (A) Ratiometric FRET live imaging of a representative RhoA-FRET neuroblastoma cell (n = six experiments). Consecutive frames were taken every second (left: generation of a ratiometric image) for 15 min. Insets on the right show a time series (1 frame every 3 min) of the magnified region denoted by the white box in the left image. Arrows indicate protrusion and retraction directions. The red line shows the initial edge profile. Scale Bar: 20 μm. (B) Quantification of mean RhoA activity (FRET ratio) in 50 stalling, protruding and retracting sections along the cell edge from RhoA neuroblastoma cells from two experiments. **p < 0.01, ***p < 0.001 using ANOVA test (C–E) Montage images showing the dynamics of RhoA activation in protruding (D) and retracting sections (E) along the cell edge. (C) Images showing the regions of interest selected for the montage (white boxes) (i, protruding region; ii, retracting region). (D,E) Montage images highlighting a low RhoA activity in protruding regions (D) and a higher RhoA activity in retracting ones (E). Intensity scale on the right in (D) applies to (A,C–E).