Figure 6.
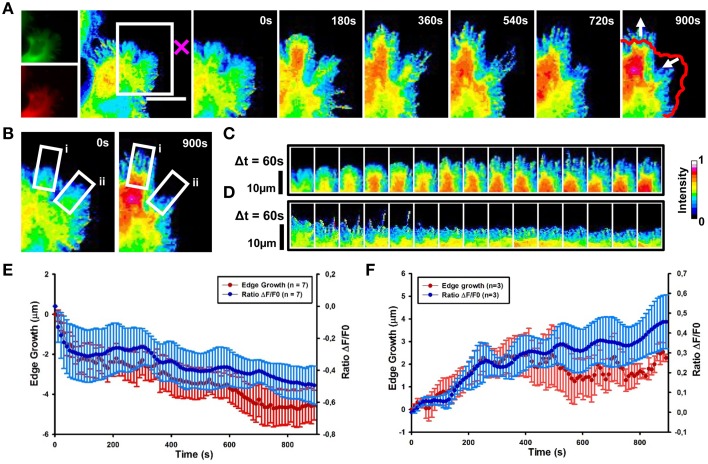
Cdc42 dynamics upon local delivery of Sema3A. (A) Cdc42 activity determined by ratiometric FRET live imaging. Frames were taken every second (left: generation of a ratiometric image) for 15 min after stimulation (the cross indicates the position of the lipid vesicle encapsulating Sema3A). Insets on the right show a time series (1 frame every 3 min) of the magnified region denoted by the white box in the left image. Arrows indicate retraction and protrusion directions. The red line shows the initial edge profile. Scale Bar: 20 μm. (B–D) Montage images showing the dynamics of Cdc42 activity in protruding and retracting regions of the cell. (B) Images showing the regions of interest selected for the montage (white boxes) (i, protruding region; ii, retracting region). (C,D) Montage images highlighting a decrease of Cdc42 activity in the retracting region of the cell facing the lipid vesicle filled with Sema3A (C) and an increase of Cdc42 activity in the protruding region, away from the vesicle (D). Images are taken at 60 s intervals. Intensity scale on the right in (D) applies to (A–D). (E) Plot of average Cdc42 activity (ΔF/F0) vs. edge growth from seven experiments. Negative values are defined as retraction. FRET ratio is represented as a blue line; edge growth is defined as a red line. (F) The same as in (E), but in this case data are obtained from three experiments. Positive values are defined as edge protrusion. Data are shown as Mean ± SEM.

