Figure 7.
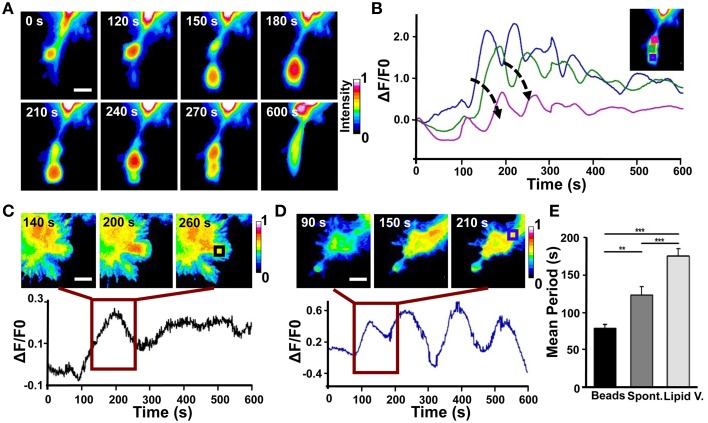
Analysis of Cdc42 wave-like behavior. (A) Time series of the active Cdc42 retrograde waves upon local stimulation with Sema3A-coated beads (Representative of three experiments). (B) Plot of average Cdc42 activity (ΔF/F0) in the regions defined by the colored squares in the inset image at the top right. The analyzed cell is the same shown in (A). Arrows indicate the temporal progression of the oscillations. (C) Top: Time series (1 frame every 60 s) of the Cdc42 oscillatory behavior upon local stimulation with lipid vesicles filled with Sema3A for the time defined by the dark red square in the bottom plot; Bottom: Plot of average Cdc42 activity (ΔF/F0) in the region defined as a black square in the image at the top right. (D) Top: Time series (1 frame every 60 s) of the Cdc42 wave behavior during spontaneous motion for the time defined by the dark red square in the bottom plot. Bottom: Plot of average Cdc42 activity (ΔF/F0) in the region defined as a blue square in the image at the top right. (E) Quantification of the period of the oscillations both during spontaneous motion and upon local stimulation. Mean period ± SEM of 10 periods from 3 experiments for bead stimulation, 10 periods from 2 experiments for spontaneous motion and 10 periods from 3 experiments for lipid vesicles stimulation. **p < 0.01, ***p < 0.01 using ANOVA test. Scalebars in (A,C,D): 10 μm.

