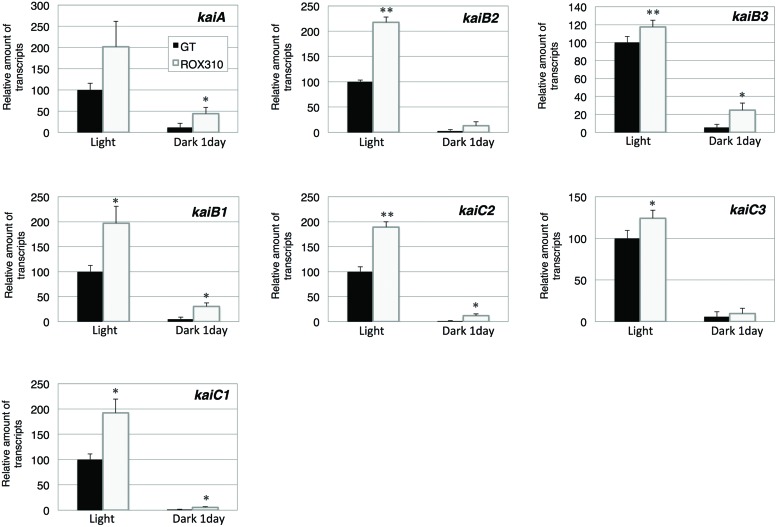
FIGURE 5.
Quantitative real-time PCR analysis of transcription in GT and ROX310. Figure shows relative transcript levels of seven genes encoding KaiABC proteins. Data represent mean ± SD from three independent experiments. Transcript levels were calibrated relative to that of the corresponding transcript in GT (set at 100%). Asterisks indicate statistically significant differences between GT and ROX310 (Student’s t-test; *P < 0.05, **P < 0.005).

