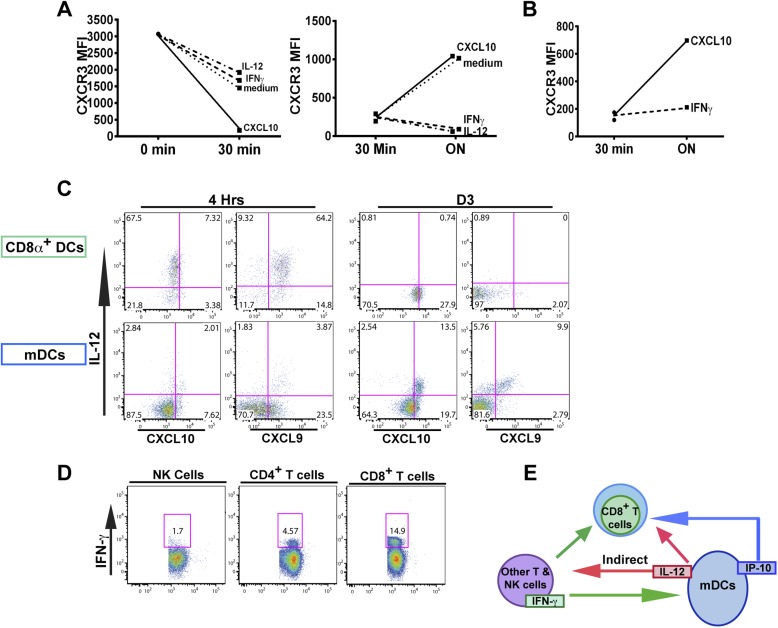
Figure 7. An alternative pathway involving IFN-γ and IFN-γ-inducible chemokines mediates suppression of CXCR3 on late-stage effector CD8+ T cell precursors.
CXCL10, IL-12, or IFN-γ was added in vitro to (A) total splenocytes or (B) purified CD8+ T cells from D7 IL-12p35−/− mice post CPS vaccination. Cells were first ‘stripped’ of CXCR3 surface expression by addition of CXCL10 for 30 min (left panel), washed, and then incubated overnight (ON) with chemokine or cytokines. KLRG1+ CD8+ T cells were analyzed for CXCR3 expression. (C) Representative FACS profiles of ex vivo ICS of IL-12 and chemokines from 4 hr or D3 after CPS vaccination. Splenocytes were analyzed for IL-12p40, CXCL9 (MIG) and CXCL10 (IP-10) production in CD11c+ CD8α+ dendritic cells (DCs), and CD11c+ CD11b+ myeloid DCs (mDCs). (D) Representative FACS profiles of IFN-γ production from NK, CD4+ and CD8+ T cells in spleens of D3 CPS vaccinated WT mice. (E) Three cell model showing that CD8+ T cells are not the direct targets of IL-12. Rather IL-12 acts through bystander T cell production of IFN-γ, which targets both the developing CD8+ T cells and mDCs to secrete IFN-γ-inducible chemokines. CXCR3 chemokine ligands together with IFN-γ directly act on the developing CD8+ T cells to downregulate CXCR3 expression. (A and B) Data are from 4 experiments of 3–5 pooled IL-12p35−/− CPS vaccinated mice each, Mean ± SEM. (C and D) Data are from 2 experiments with 3–4 WT mice each.


