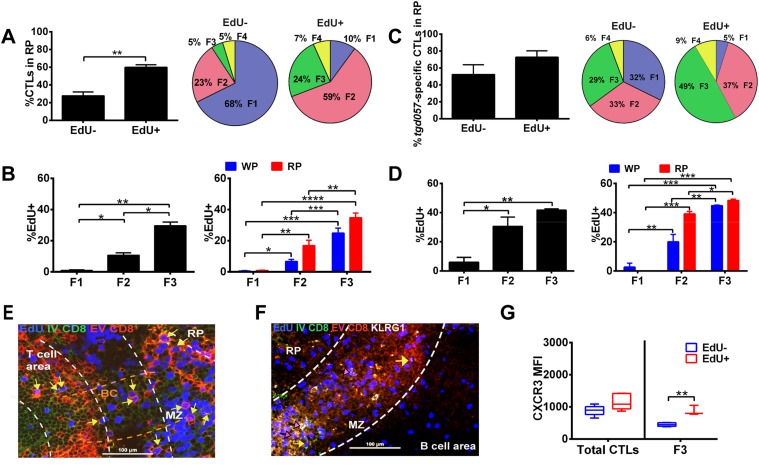
Figure 8. Generation of terminally differentiated CD8+ T cells occurs after cessation of proliferation in the splenic RP.
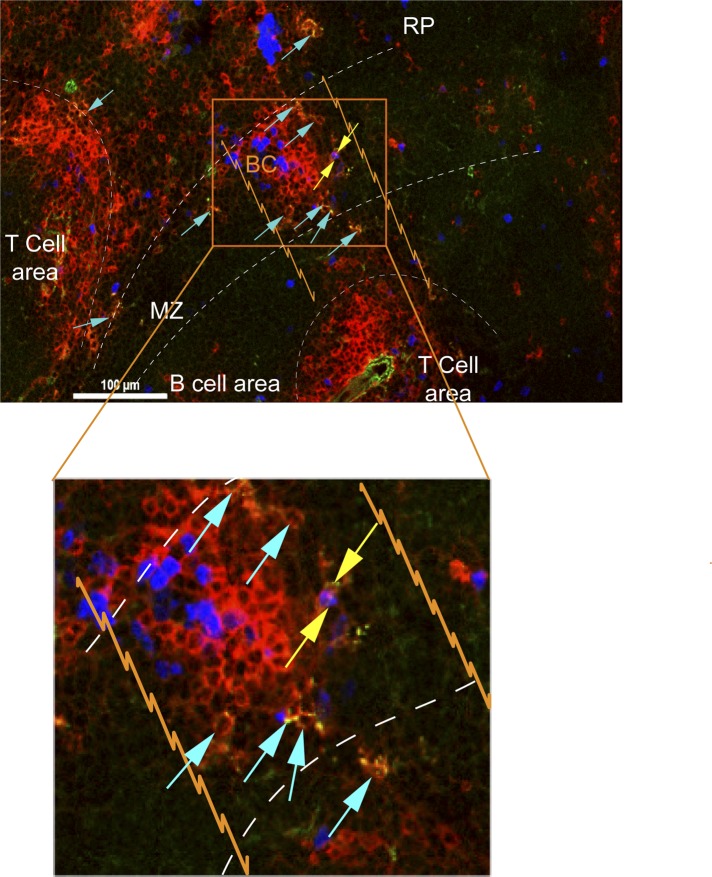
D5.5 post CPS vaccinated WT mice were first injected i.p. with EdU 2 hr prior to sacrifice, then injected i.v. with 4 μg of anti-CD8-FITC antibody and sacrificed within 2–3 min. The differential localization and fractional distribution of F1–F4 stages in EdU− and EdU+ (A) for total CD8+ T cells and (C) tgd057-specific CD8+ T cells are shown. The rate of EdU-positivity as a function of differentiation stage (B, D left panels) or differentiation stage and i.v. anti-CD8 accessibility (B, D right panels) are shown for total CD8+ T cells (B) and tgd057-specific CD8+ T cells (D). Immunofluorescence images showing D5.5 splenic localization of EdU+ and double-positive for IV α-CD8 and ex vivo α-CD8 antibodies (E), and KLRG1 (F) staining. Splenic compartments are represented as follows: dashed line, MZ border; RP–red pulp; BC–bridging channel; MZ–marginal zone. Sections were stained for IV α-CD8 (green, CD8), ex vivo α-CD8 (red, EX CD8), EdU (blue), α-KLRG1 (white). Key to symbols: Yellow arrows: EdU+ IV CD8+ EV CD8+, Pink Arrows: EdU+ KLRG1+ IV CD8+ EV CD8+. Expression of CXCR3 in proliferating and non-proliferating CD8+ T cells (G). Data are from 2 experiments of 3–5 CPS vaccinated mice each. Immunofluorescence represents more than six sections per mouse taken from three mice. Mean ± SEM. Student's t-test or ANOVA analysis was done Holms-Sidak post hoc test, *p < 0.01, **p < 0.001 and ***p < 0.0001. Refer to Figure 8—figure supplement 1 for IHC image of EdU+ CD8+ T cells in splenic bridging channels.


