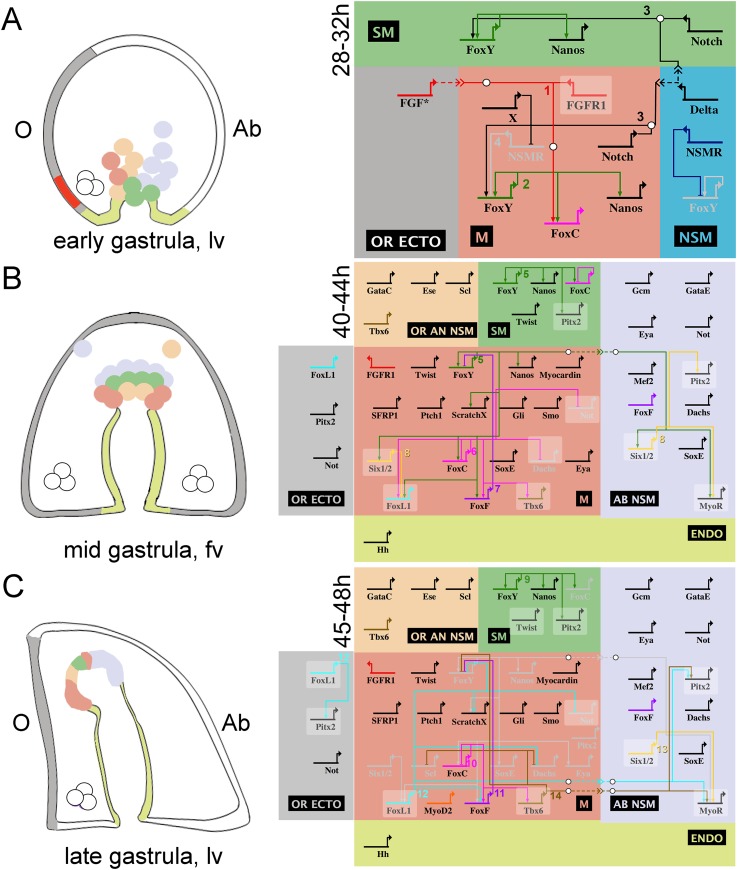
Figure 7. Schematic representation and view from all nuclei of the NSM regulatory interactions in early, mid, and late sea urchin gastrulae.
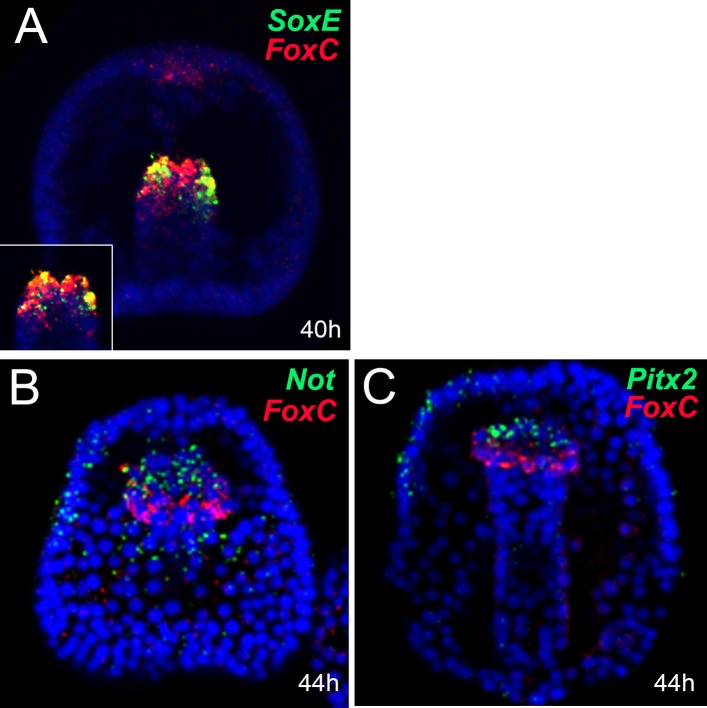
On the left side, three developmental stages of the sea urchin embryo are schematized: (A) early, (B) mid, and (C) late gastrula stage. On the right side, the genetic interactions found within this study are summarized. Different colors are used for each domain showing exclusive regulatory states: oral animal non-skeletogenic mesodermal (NSM) (OR AN NSM), salmon pink; NSM, blue; aboral NSM (AB NSM), lavender; small micromere derivatives (SM), green; myogenic domain (M), light red; endoderm (ENDO), yellow-green; oral ectoderm (OR ECTO), light gray. Genes are presented as horizontal thick lines and their names are reported below the thick lines. The wiring among the genes is shown with solid lines, although none of them has been demonstrated to be direct. Arrows represent positive regulation, bars represent repression, and white bullets, together with the dashed lines, indicate signaling events. Genes that are expressed in more than one domain, for which the putative inputs were revealed by NanoString but not validated by spatial expression analysis, are shown on a shaded background. The asterisk in A relates to the fact that we did not demonstrate which FGF factor signals to FGFR1. A co-expression analysis of several genes included in the gene regulatory network (GRN) diagrams is reported in Figure 7—figure supplement 1. Numbers associated to inputs indicate the evidence for all interactions reported and are listed in Figure 7—source data 1.
DOI: http://dx.doi.org/10.7554/eLife.07343.022


