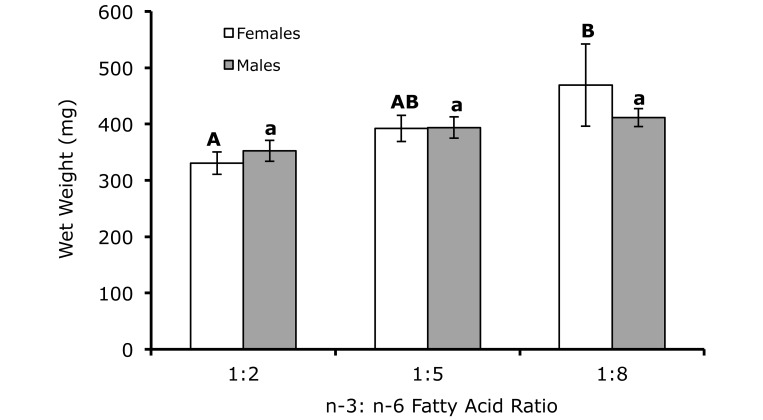
Figure 1.
Wet weights for male (n = 10 per treatment) and female (n = 10 per treatment) zebrafish fed diets varying in the ratio of ω3:ω6 fatty acids. Different letters indicate significant (P < 0.05) differences within sex. Male wet weights increased nominally (P = 0.07) with increasing ω6 fatty acids.

