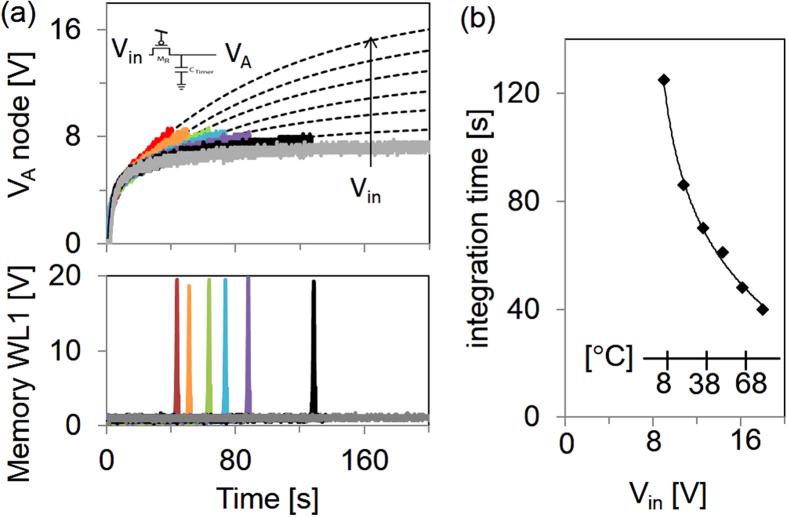
Figure 3.
(a) Signals at node VA and WL1 as a function of time and Vin, where Vin varies from 7.2 V to 18.0 V in increments of 1.8 V. The dotted lines are based on double exponential fits. (b) The circuit integration time as a function of Vin. The Vin axis is converted to a temperature scale (inset), for an instance with thermistor divider calibrated to Vbias = 30 V.

