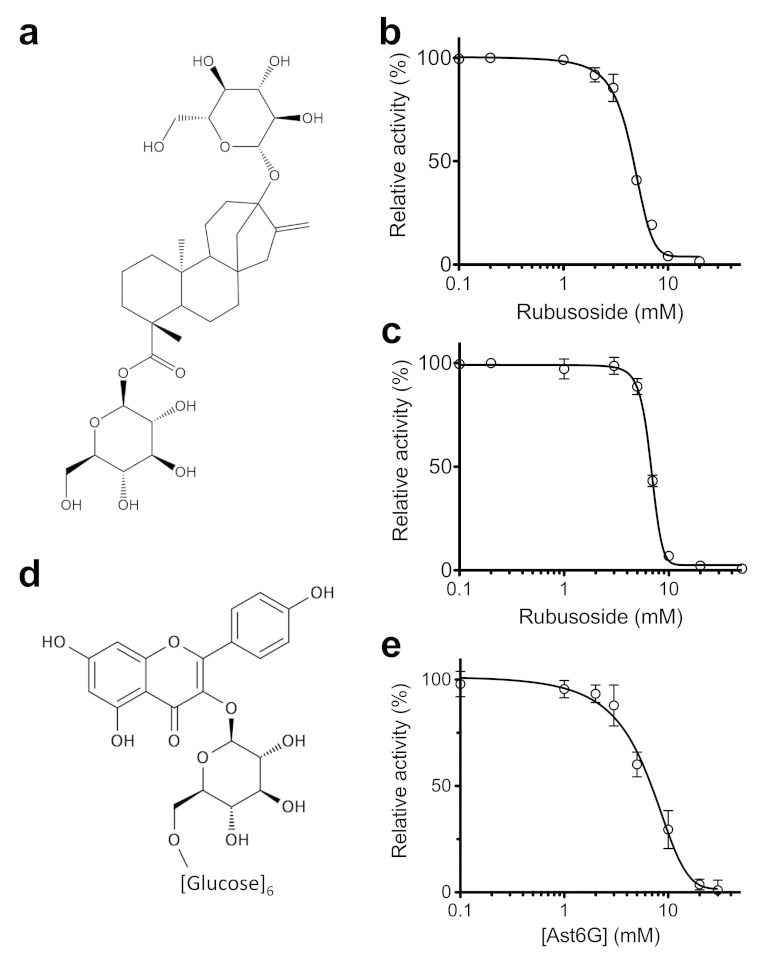
Figure 2. Inhibition curves of GLUT1 and GLUT5 by Rub and Ast6G.
The inhibition in proteoliposomes was measured by the entrance counter-flow assay. Each data point is the average of at least three measurements and error bars represent standard deviation. Line shows non-linear fit for IC50 calculation. (a) Structure of Rub. (b) Inhibition of GLUT1-mediated glucose transport by Rub. (c) Inhibition of GLUT5-mediated fructose transport by Rub. (d) Structure of Ast6G; six glucose units are attached to the astragalin flavonoid head group. (e) Inhibition of GLUT5-mediated fructose transport by Ast6G.

