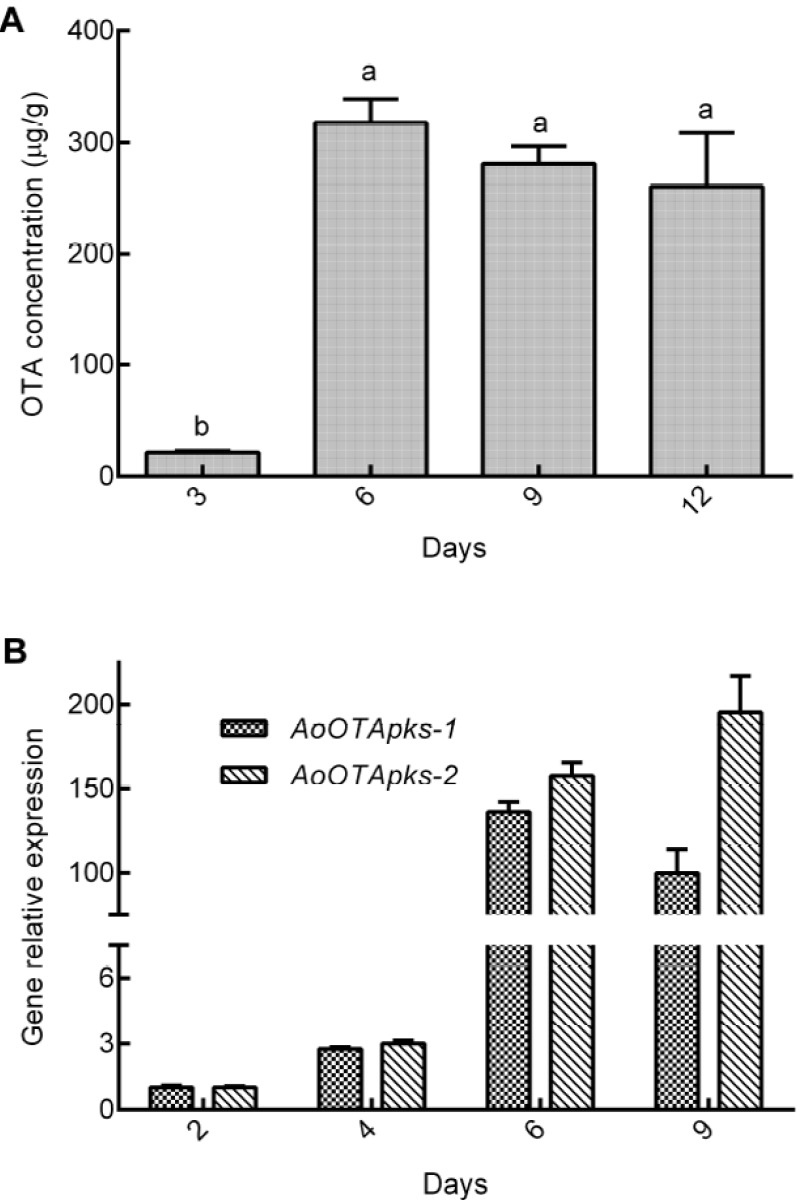
Figure 4.
(A) The changes in the amount of OTA product at different time points during the growth of A. ochraceus fc-1. OTA concentrations were determined by HPLC-FLD using an OTA standard; (B) Relative expression of the AoOTApks-1 and -2 genes was assayed at different time points using a 7500 real-time PCR system. The glyceraldehyde 3-phosphate dehydrogenase (GADPH) gene was used as a control.

