Figure 3.
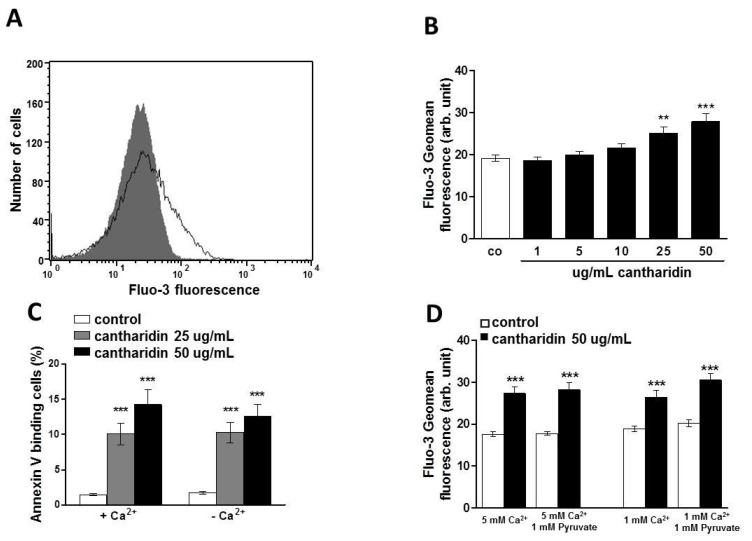
Effect of cantharidin on erythrocyte Ca2+ activity and Ca2+ sensitivity of cantharidin-induced phosphatidylserine exposure: (A) Original histogram of Fluo3 fluorescence in erythrocytes following exposure for 48 h to Ringer solution without (grey area) and with (black line) presence of cantharidin (50 μg/mL). (B) Arithmetic means ± SEM (n = 12) of the Fluo3 fluorescence (arbitrary units) in erythrocytes exposed for 48 h to Ringer solution without (white bar) or with (black bars) cantharidin (1–50 μg/mL). (C) Arithmetic means ± SEM (n = 20) of annexin-V-binding of erythrocytes after a 48 h treatment with Ringer solution without (white bars) or with 25 μg/mL (grey bars) or 50 μg/mL (black bars) cantharidin in the presence (left bars, +Ca2+) and absence (right bars, −Ca2+) of Ca2+. ** (p < 0.01) *** (p < 0.001) indicate significant difference from the absence of cantharidin (ANOVA). (D) Arithmetic means ± SEM (n = 9) of the Fluo3 fluorescence (arbitrary units) in erythrocytes exposed for 48 h to Ringer solution without (white bar) or with (black bars) cantharidin (50 μg/mL) and stained with Fluo3 AM in Ringer solution with (left bars) 5 mM CaCl2 ± 1 mM sodium pyruvate, or with (right bars) 1 mM CaCl2 ± 1 mM sodium pyruvate. *** (p < 0.001) indicate significant difference from the absence of cantharidin (ANOVA).

