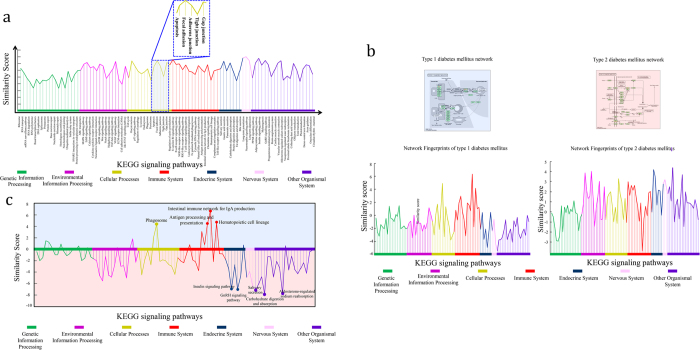
Figure 1. The concept map of network fingerprint (taking T1DM and T2DM as examples).
(A) The structure of network fingerprint of disease network based on the KEGG signaling pathways. The Different kinds of pathways are represented as different colors. (B) Molecular network of T1DM and T2DM in KEGG database and their corresponding network fingerprints. (C) The difference between the network fingerprints of T1DM and T2DM.

