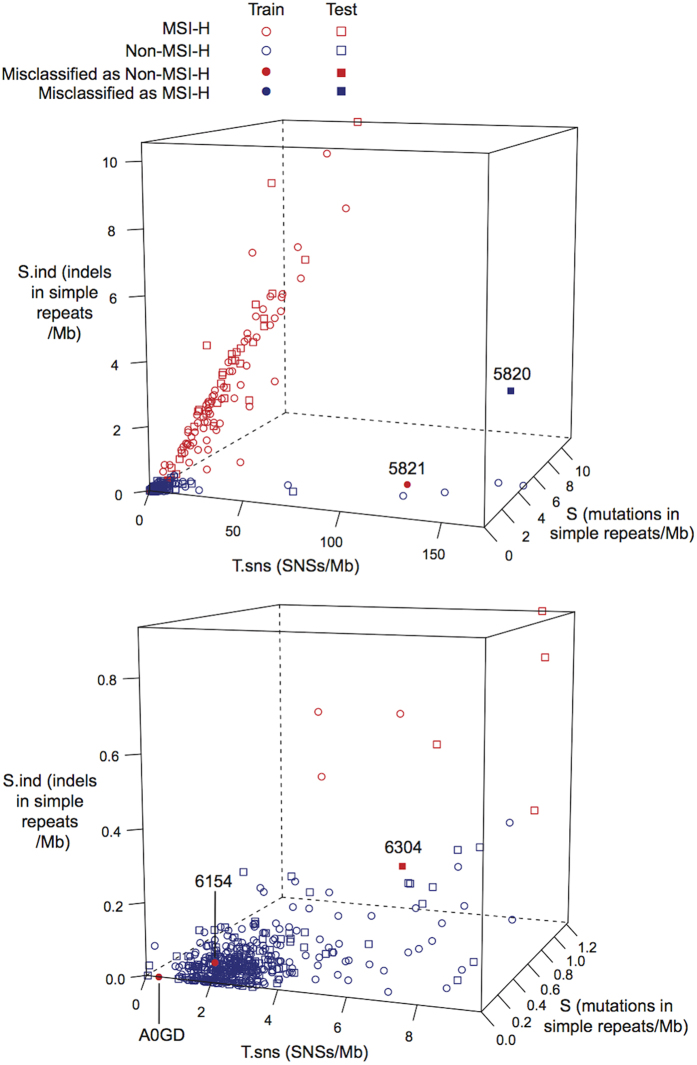
Figure 2. 3-D plot of the variables S.ind, T.sns, and S in the training and test sets.
The lower panel is a close-up view for S.ind ≤1, T.sns ≤10, and S ≤1.23. Tumors with discordant classification by NGSclassifier and laboratory tests are labeled by the last four characters of the tumor identifier.

