Figure 5.

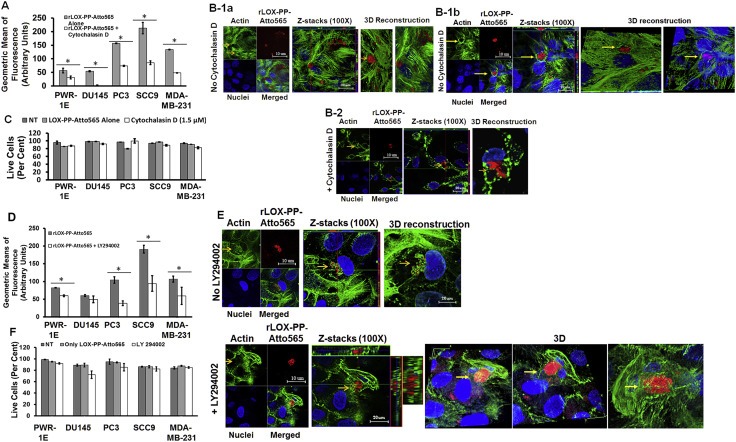
Inhibition of rLOX‐PP‐Atto565 uptake in the presence or absence of cytochalasin D (A–C) or LY294002 (D–F). (A) After 3 h rLOX‐PP‐Atto565 uptake was quantified by flow cytometry in absence (grey) and presence of 1.5 μM cytochalasin D (white); n = 3; *, two‐tailed p‐value > 0.0002. SCC9 cells were pre‐incubated on ice for 30 min in the absence (B‐1a and B‐1b) or presence (B‐2) of cytochalasin D. rLOX‐PP‐Atto565 was added in the presence or absence of cytochalasin D for an additional 15 min on ice, and then incubated at 37 °C for 15 min in the 5% CO2 incubator. Cells were stained for F‐actin (green) and DNA (blue) and indicate that 1.5 μM cytochalasin D disrupted actin filaments, as expected. Merged Z‐series images of without cytochalasin (B‐1a and B1b) and with cytochalasin D (B‐2) treatment were reconstructed with the LSM image viewer software. (C) The LIVE/DEAD® Fixable Near‐IR stain assay determined the percentage of live cells in each sample. (NT, dark gray bars; non treated control cells; rLOX‐PP‐Atto565, light gray bars; rLOX‐PP‐Atto565 + cytochalasin D, white bars). (D) rLOX‐PP‐Atto565 uptake was quantified by flow cytometry in the absence (gray bar) and in the presence of 100 μM LY294002 (white bar). Data are means ± SD; n = 3; *, two‐tailed p‐value>0.0006. (E) SCC9 cells were treated with rLOX‐PP‐Atto565 (red) for 15 min and stained for F‐actin (green) and DNA (blue) in absence and presence of 100 μM LY294002. Merged Z‐series images of B without LY294002 (above) and with LY294002 (below) treatment were reconstructed with image J software. 3 dimensional images from various angles show cup formation that open to plasma membrane (F). The LIVE/DEAD® Fixable Near‐IR stain assay was employed to determine the percentage of live cells in each cell lines; NT, dark gray bars, non‐treated control cells; rLOX‐PP‐Atto565, light gray bars; LY294002 plus rLOX‐PP‐Atto565, white bars.
