Figure 7.

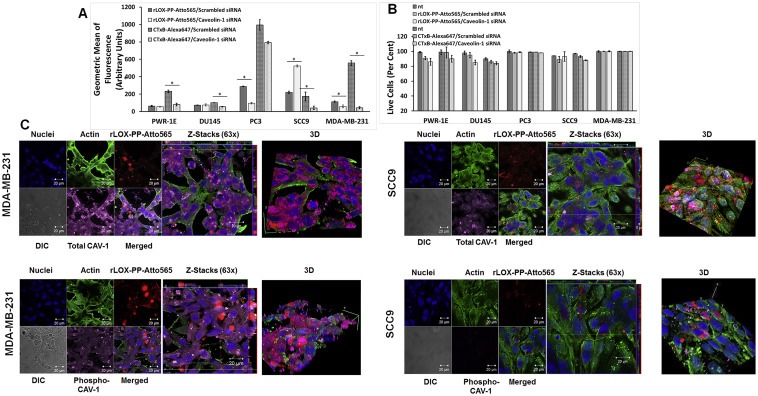
Inhibition of caveolae‐mediated rLOX‐PP‐Atto565 and CtxB‐Alexa647 uptake by siRNA knockdown of the primary caveolae protein caveolin‐1. (A) After transfection, cells were serum starved for 12 h followed by incubation with or without rLOX‐PP‐Atto565 or CtxB‐Alexa647 for an additional 3 h rLOX‐PP‐Atto565 (solid gray and white) and CtxB‐Alexa 647 (dashed gray and white) uptake were quantified by flow cytometry with (white) and without of CAV‐1 knockdown (gray); Data are means ± SD, n = 3.; *, two‐tailed p‐value < 0.005 (B) The LIVE/DEAD® Fixable Near‐IR stain assay was employed to determine the percentage of live cells in each sample. (NT, dark solid or dashed gray bars; non‐treated control cells; rLOX‐PP‐Atto565 or CtxB‐Alexa647, solid or dashed light gray bars; rLOX‐PP‐Atto565 or CtxB‐Alexa647 + caveolin‐1 siRNA knockdown, solid or dashed light white bars). Data are means ± SD, n = 3. (C) MDA‐MB‐231 (left) and SCC9 cells (right) were transfected with either caveolin‐1 siRNA or control siRNA. 60 h after transfection, cells were serum starved for 12 h followed by incubation with or without rLOX‐PP‐Atto565 (red) for an additional 15 min on ice, and then incubated at 37 °C for 15 min in the 5% CO2 incubator. Cells then were fixed, permeabilized and stained for F‐actin (green), DNA (blue) and total caveolin‐1 (magenta) or phospho caveolin‐1 (magenta). Merged Z‐series images with rLOX‐PP‐Atto565 (above) and without rLOX‐PP‐Atto565 (below) treatment were reconstructed with Zen Black Edition software. 3D images were constructed with Image J software.
