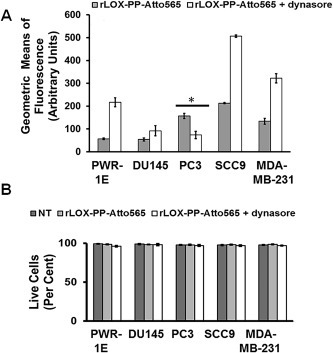
Figure 10.

Inhibition of clathrin‐mediated uptake of rLOX‐PP‐Atto565 in presence or absence of dynasore. (A) After 3 h, rLOX‐PP‐Atto565 uptake quantified with flow cytometry in absence (gray bar) and presence of 100 μM dynasore (white bar); *, significant inhibition of uptake in PC3 cells only (p < 0.000125; n = 3). Up‐regulation occurred in all other cell lines. (B) The LIVE/DEAD® Fixable Near‐IR stain assay was employed to determine the percentage of live cells. NT (dark gray bars), non‐treated control cells; rLOX‐PP‐Atto565 (light gray bars); rLOX‐PP‐Atto565 plus dynasore (white bars). Data are means ± SD, n = 3.
