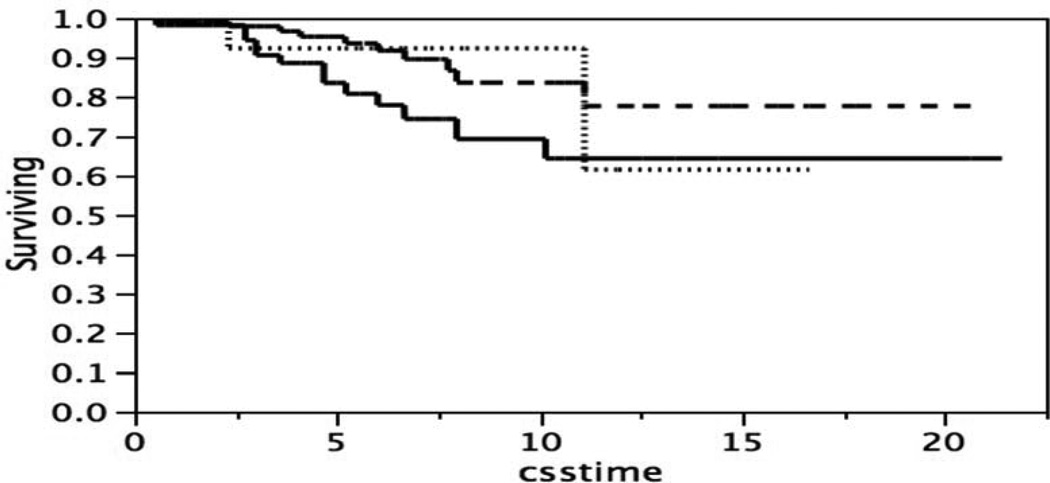
Figure 5.
Kaplan-Meier survival curves, patients classified by p53 stain intensity with two cut points of the distribution in Figure 2. p53 stain intensity one standard deviation below the mean (____), n = 57; within one standard deviation of the mean (- - - -), n = 115; or one standard deviation above the mean (……..), n = 14. Log-Rank test p = 0.1138, Wilcoxon test p = 0.802.

