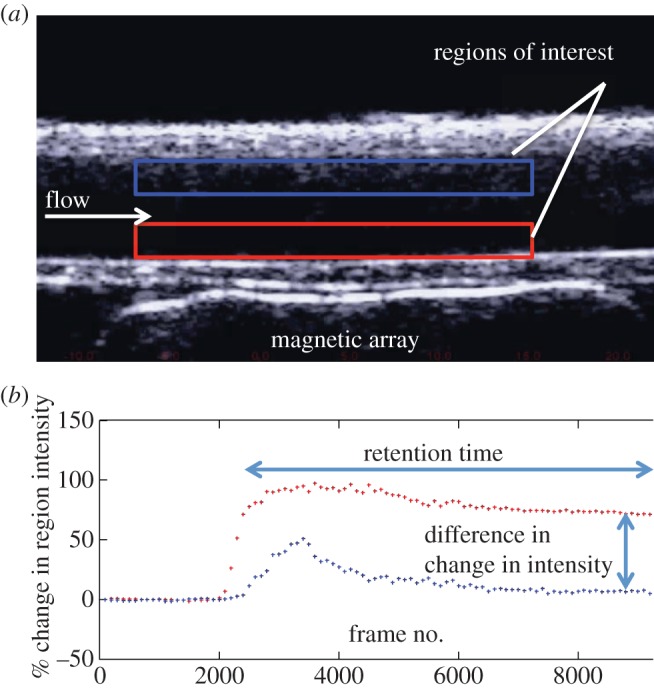
Figure 3.

(a) Example of image obtained in ultrasound flow phantom showing regions of interest at the upper and lower surfaces of the tube and (b) example of graph showing change in intensity within both regions of interest (microbubbles arrive at the section of the tube under the ultrasound probe after approx. 2000 frames).
