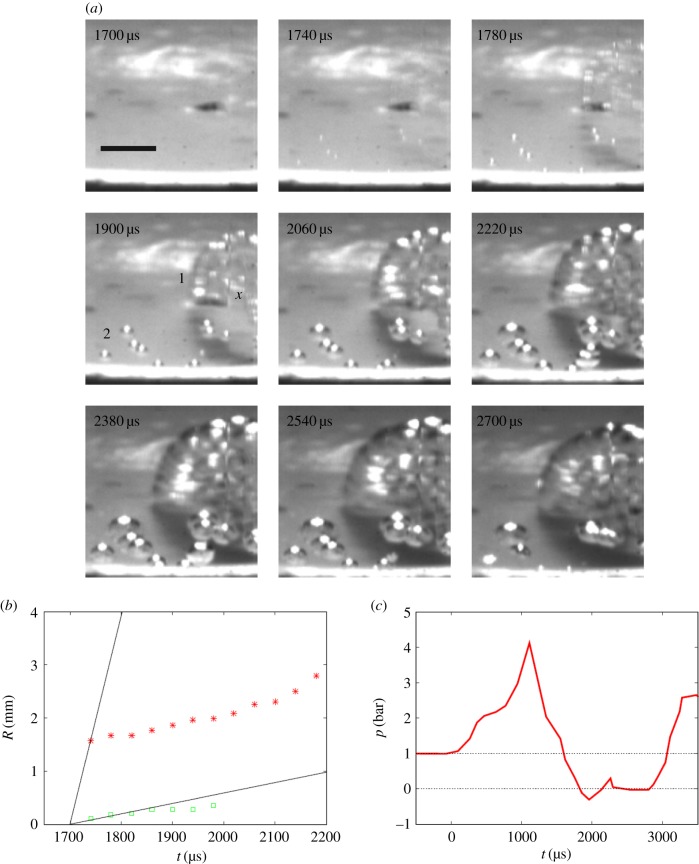
Figure 15.
(a) Video of explosive cavitation event, bubble 1, but slow growth of bubble 2. (b) The initial growth rate of bubble 1 (red asterisks) gives TS = 23 bar, while bubble 2 (green squares) has a TS < 1 bar. (c) Associated HF-filtered C-pulse with a subsequent T-pulse generated at t ≈ 1700 µs. The pressure was measured 71 mm from the bottom centre. (Reproduced with permission from [36]. Copyright © Cambridge University Press.) (Online version in colour.)

